The tools that matter
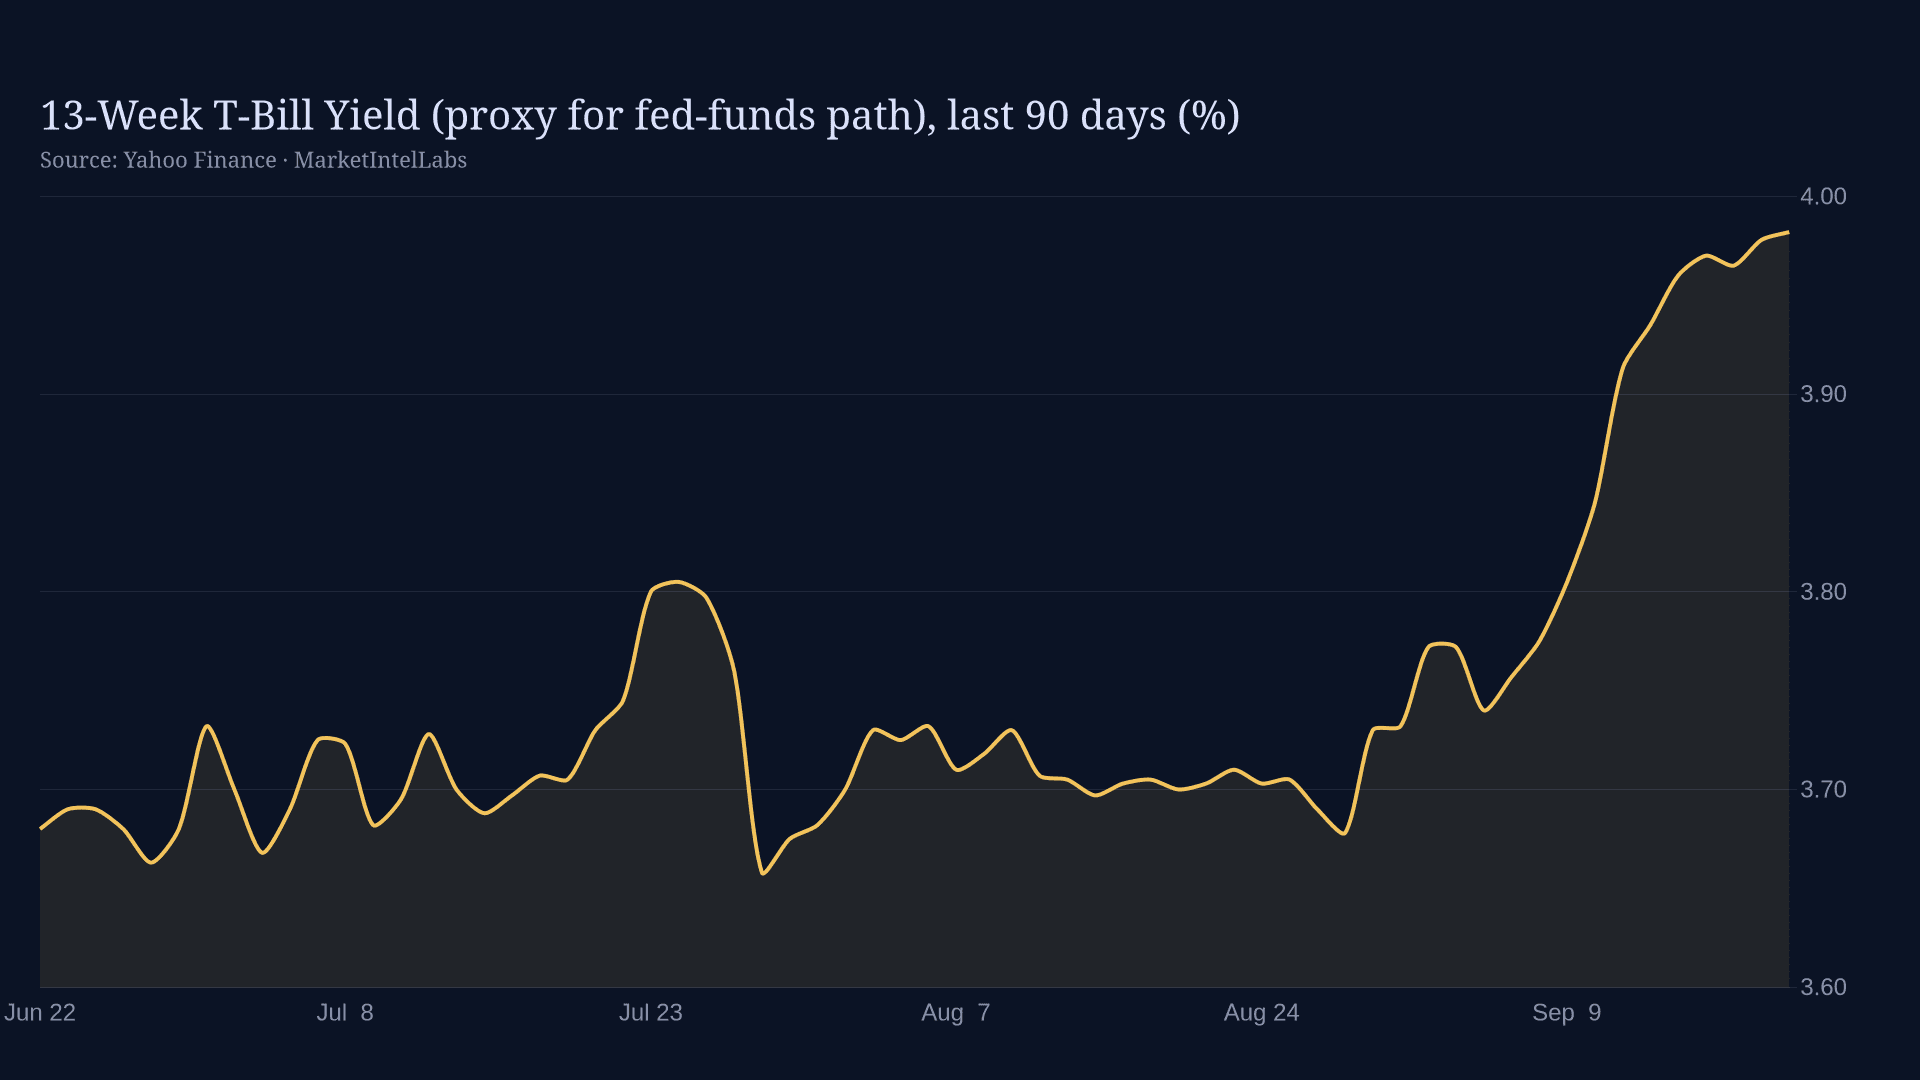
The federal funds target range is the headline instrument, but markets trade the whole expected path of policy, not the current setting. A 'hawkish hold', where rates stay unchanged while projections shift higher, can tighten financial conditions more than an actual hike. That is why our FOMC coverage spends as much time on the Summary of Economic Projections and the dot plot as on the decision itself.
The balance sheet is the second lever. Quantitative tightening drains reserves from the banking system and puts steady upward pressure on term premia; changes to the runoff pace are a policy signal in their own right. We track the H.4.1 release for what the Fed does, not just what it says.
The dual mandate trade-off
The Fed is legally bound to pursue both maximum employment and stable prices, defined as 2% PCE inflation over time. The hard regimes are the ones where the mandates conflict, with inflation above target while the labor market softens, because the Fed must choose which miss to tolerate. Those are the periods when Fed communication gets noisy, dissents multiply and markets whipsaw on every data print.
Our framework watches three data families in order of importance to the current regime: inflation (CPI, PCE, and crucially the services-ex-housing core the Fed has emphasized), labor (payrolls, unemployment, quits and wage growth), and financial conditions (credit spreads, equity multiples, the dollar). Which family dominates rotates with the cycle, and identifying that rotation early is where the alpha is.
How expectations get priced
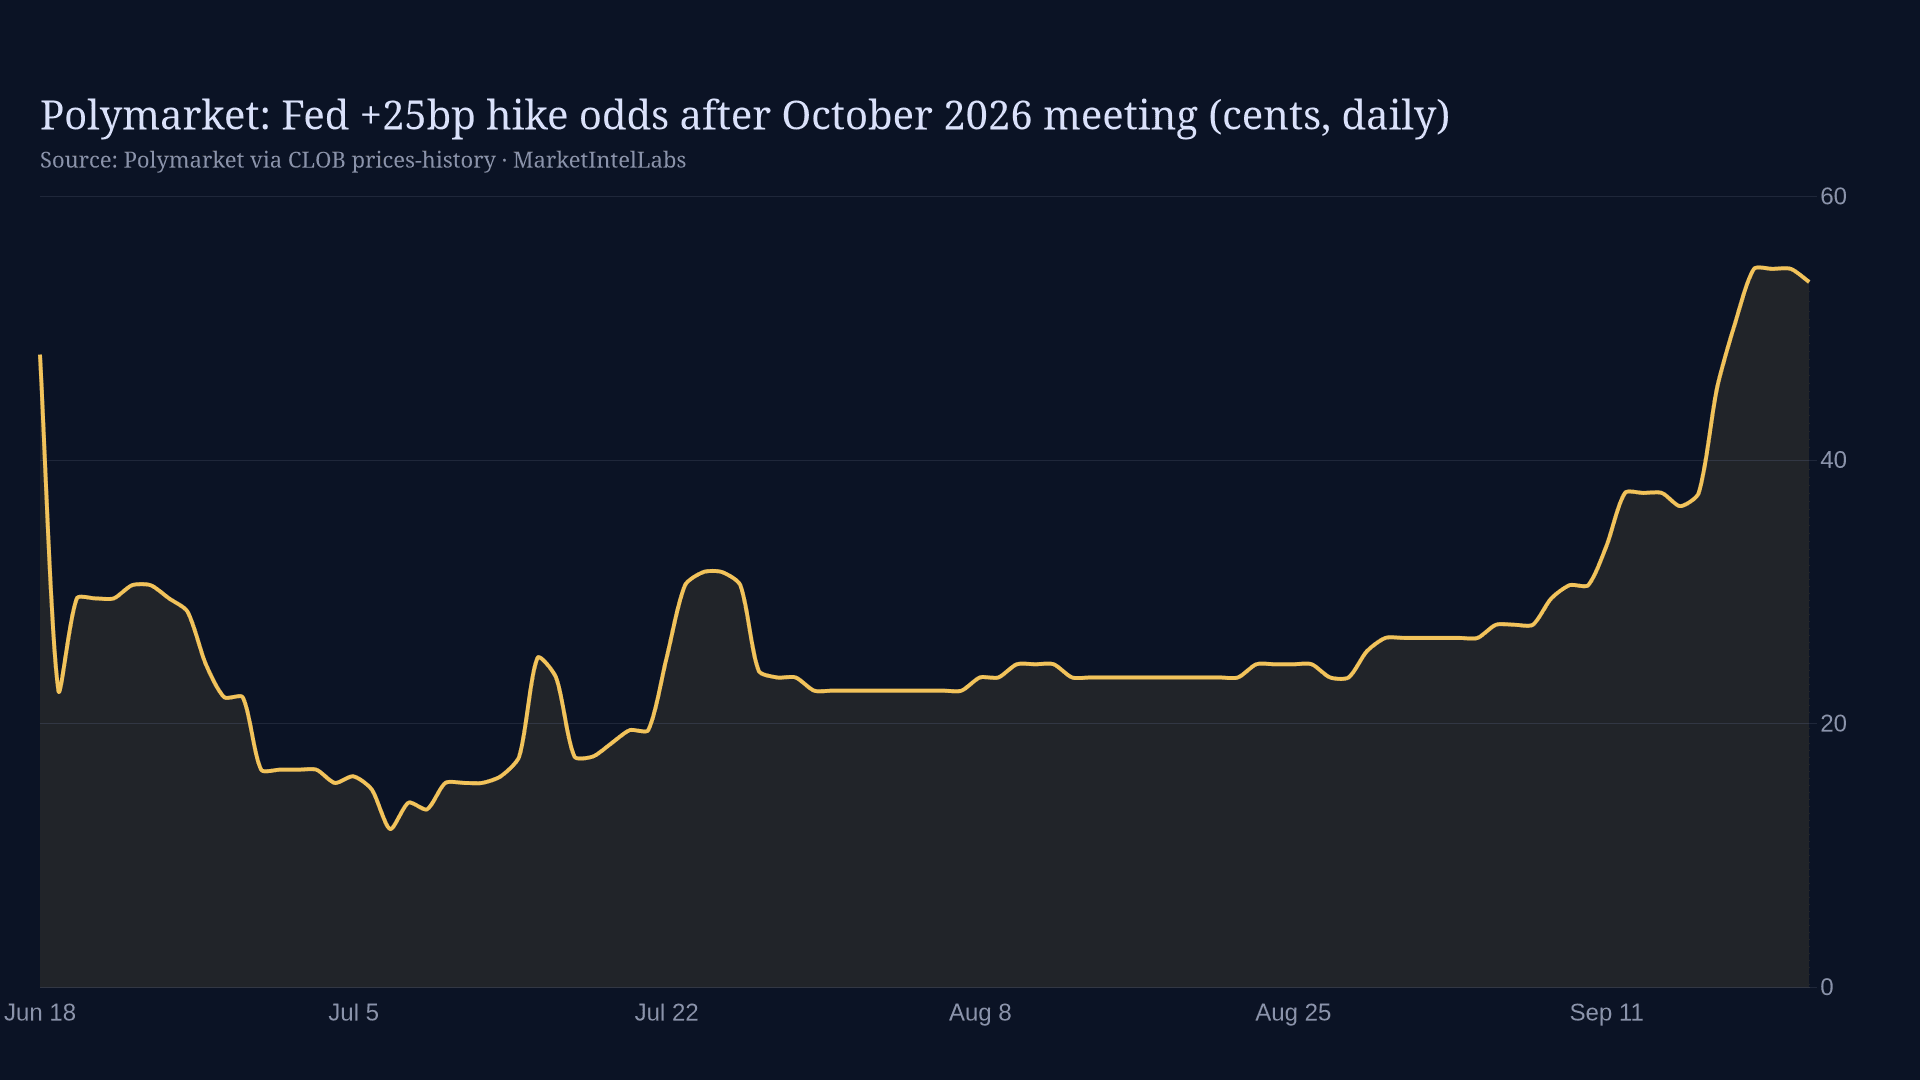
Fed funds futures and overnight index swaps translate policy expectations into tradable odds; the CME FedWatch probabilities quoted in our articles come from these markets. The important discipline is separating what is priced from what is forecast: a rate cut that markets assign 90% odds moves nothing when delivered; the surprise is in the path revision. Our pieces always anchor on what the curve already discounts before arguing where it is wrong.
Frequently asked questions
What is the dot plot?expand_more
Four times a year, each FOMC participant anonymously plots where they think the policy rate should be at the end of coming years. The median dot becomes the market's shorthand for the Fed's intended path. Dots are projections, not commitments, but revisions to the median move markets as much as actual decisions.
What is the difference between the Fed's rate and mortgage or loan rates?expand_more
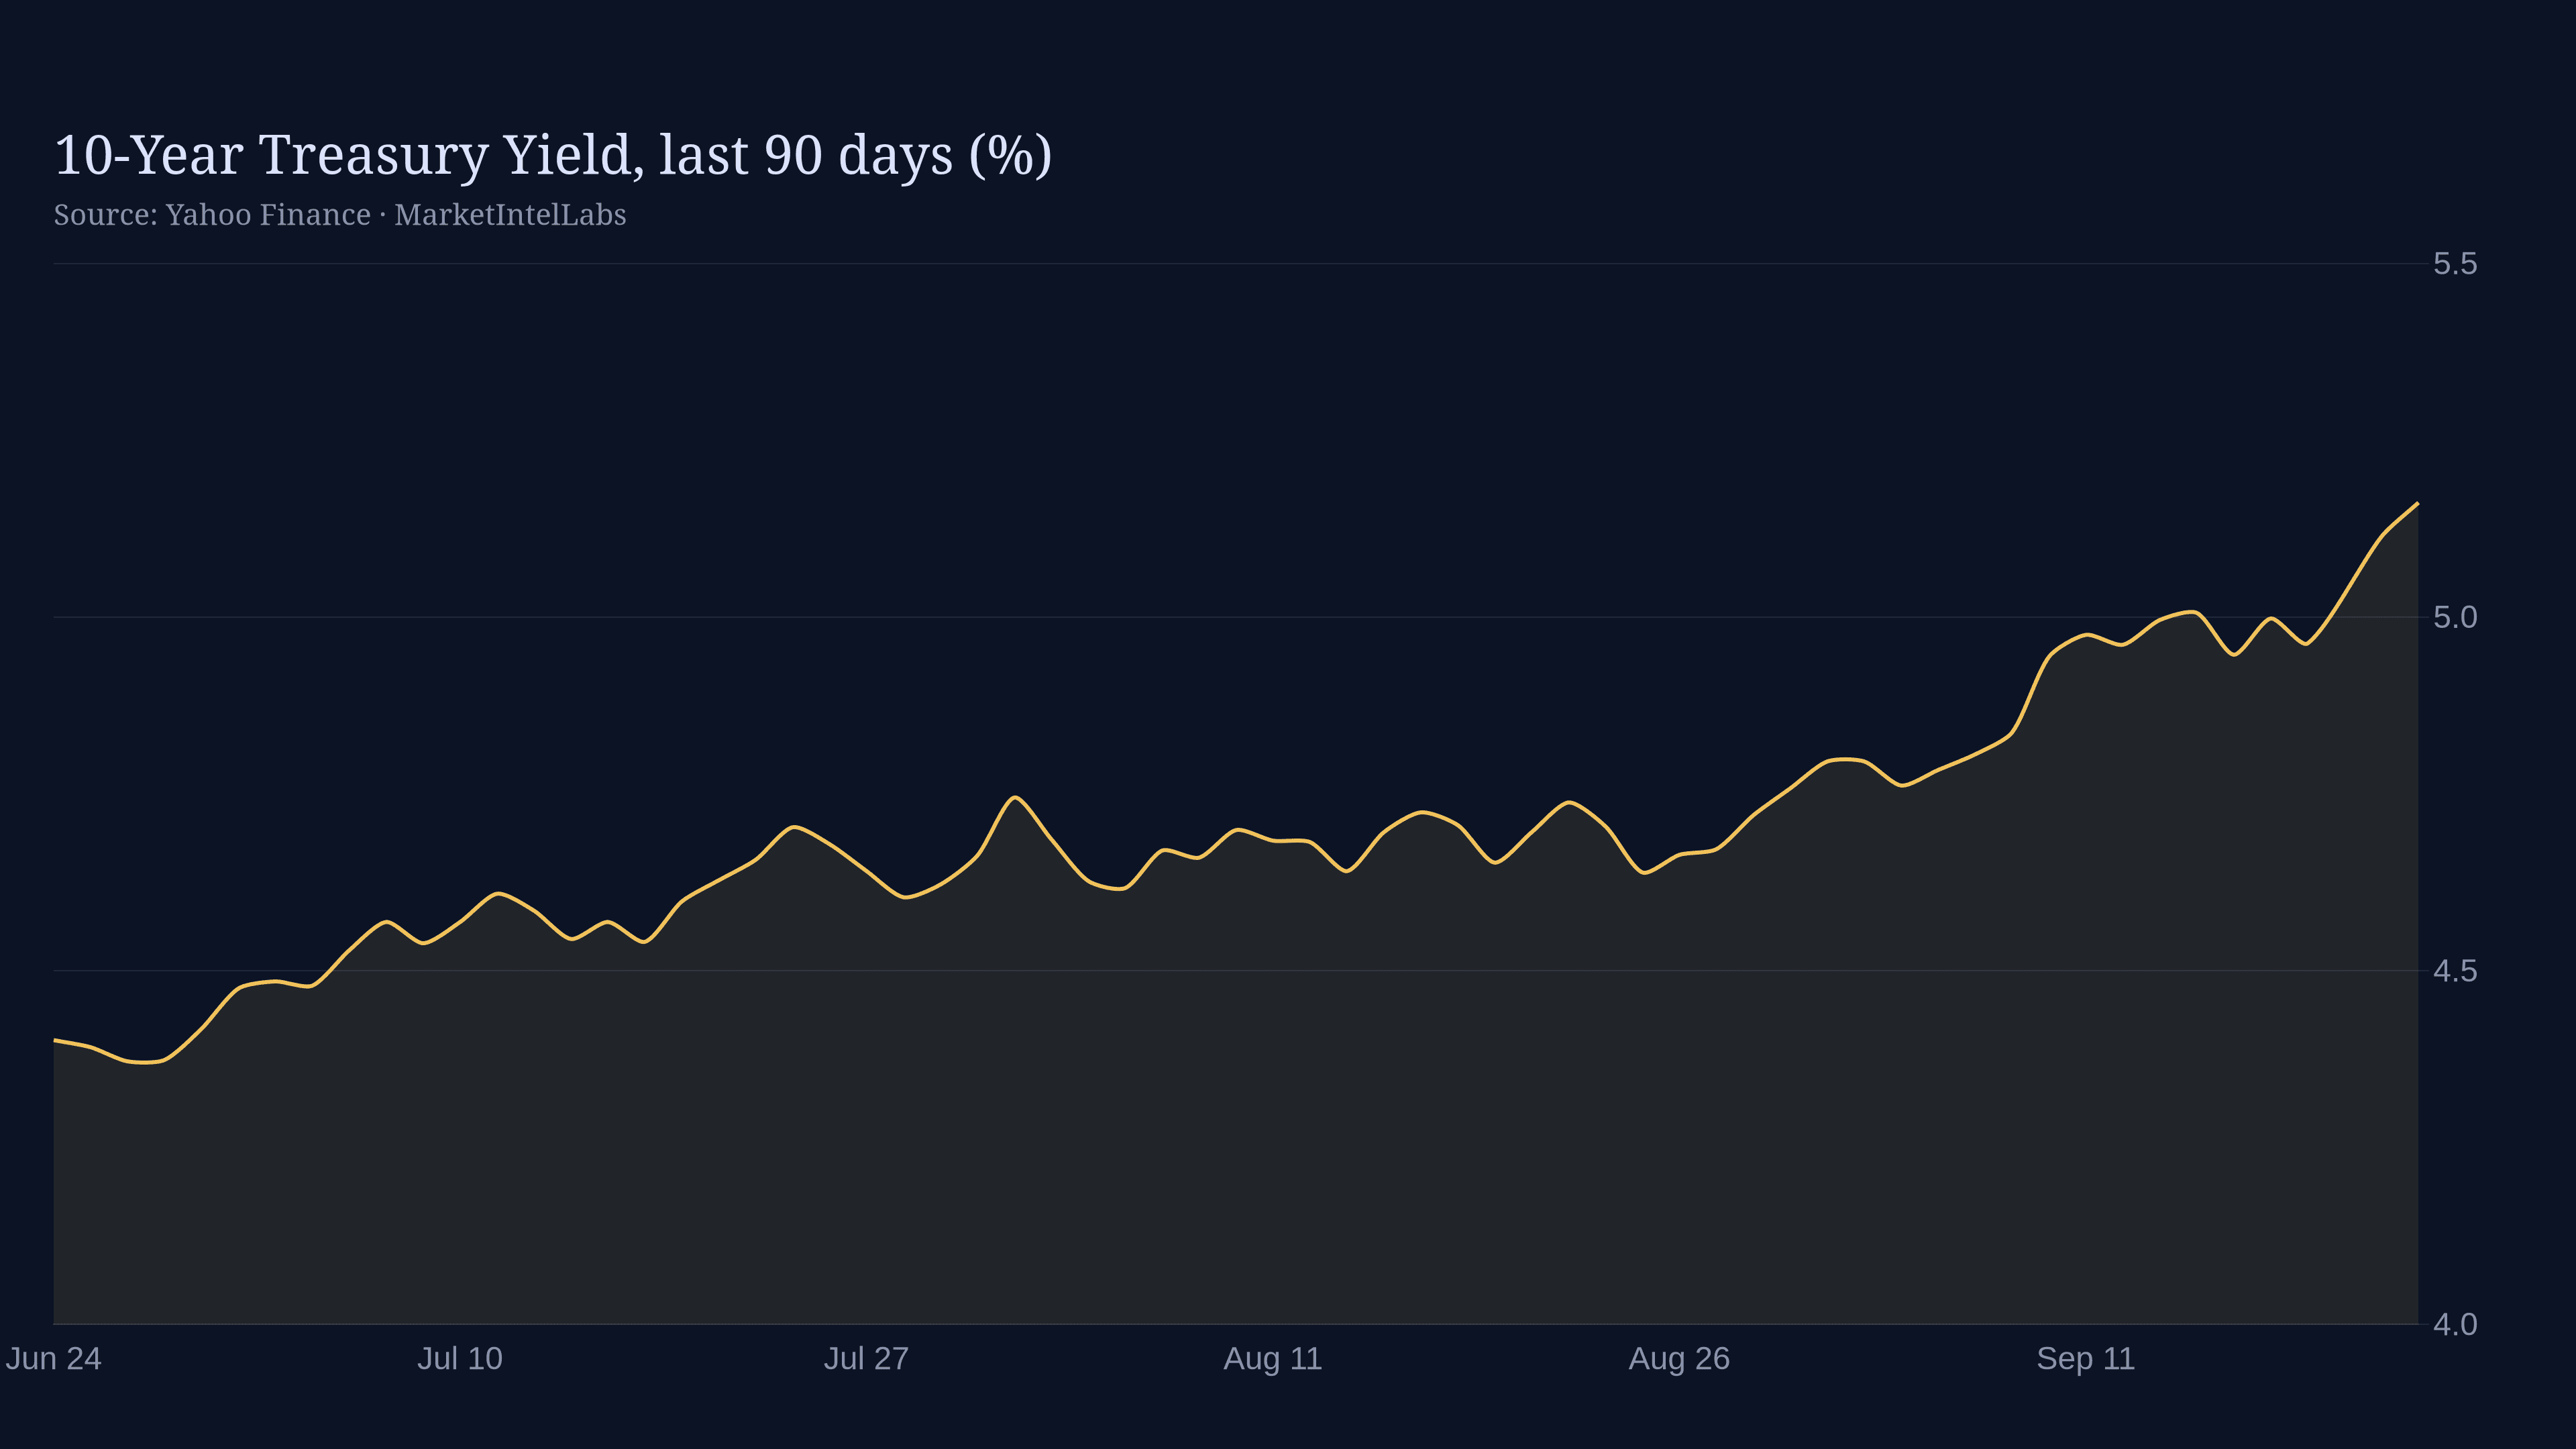
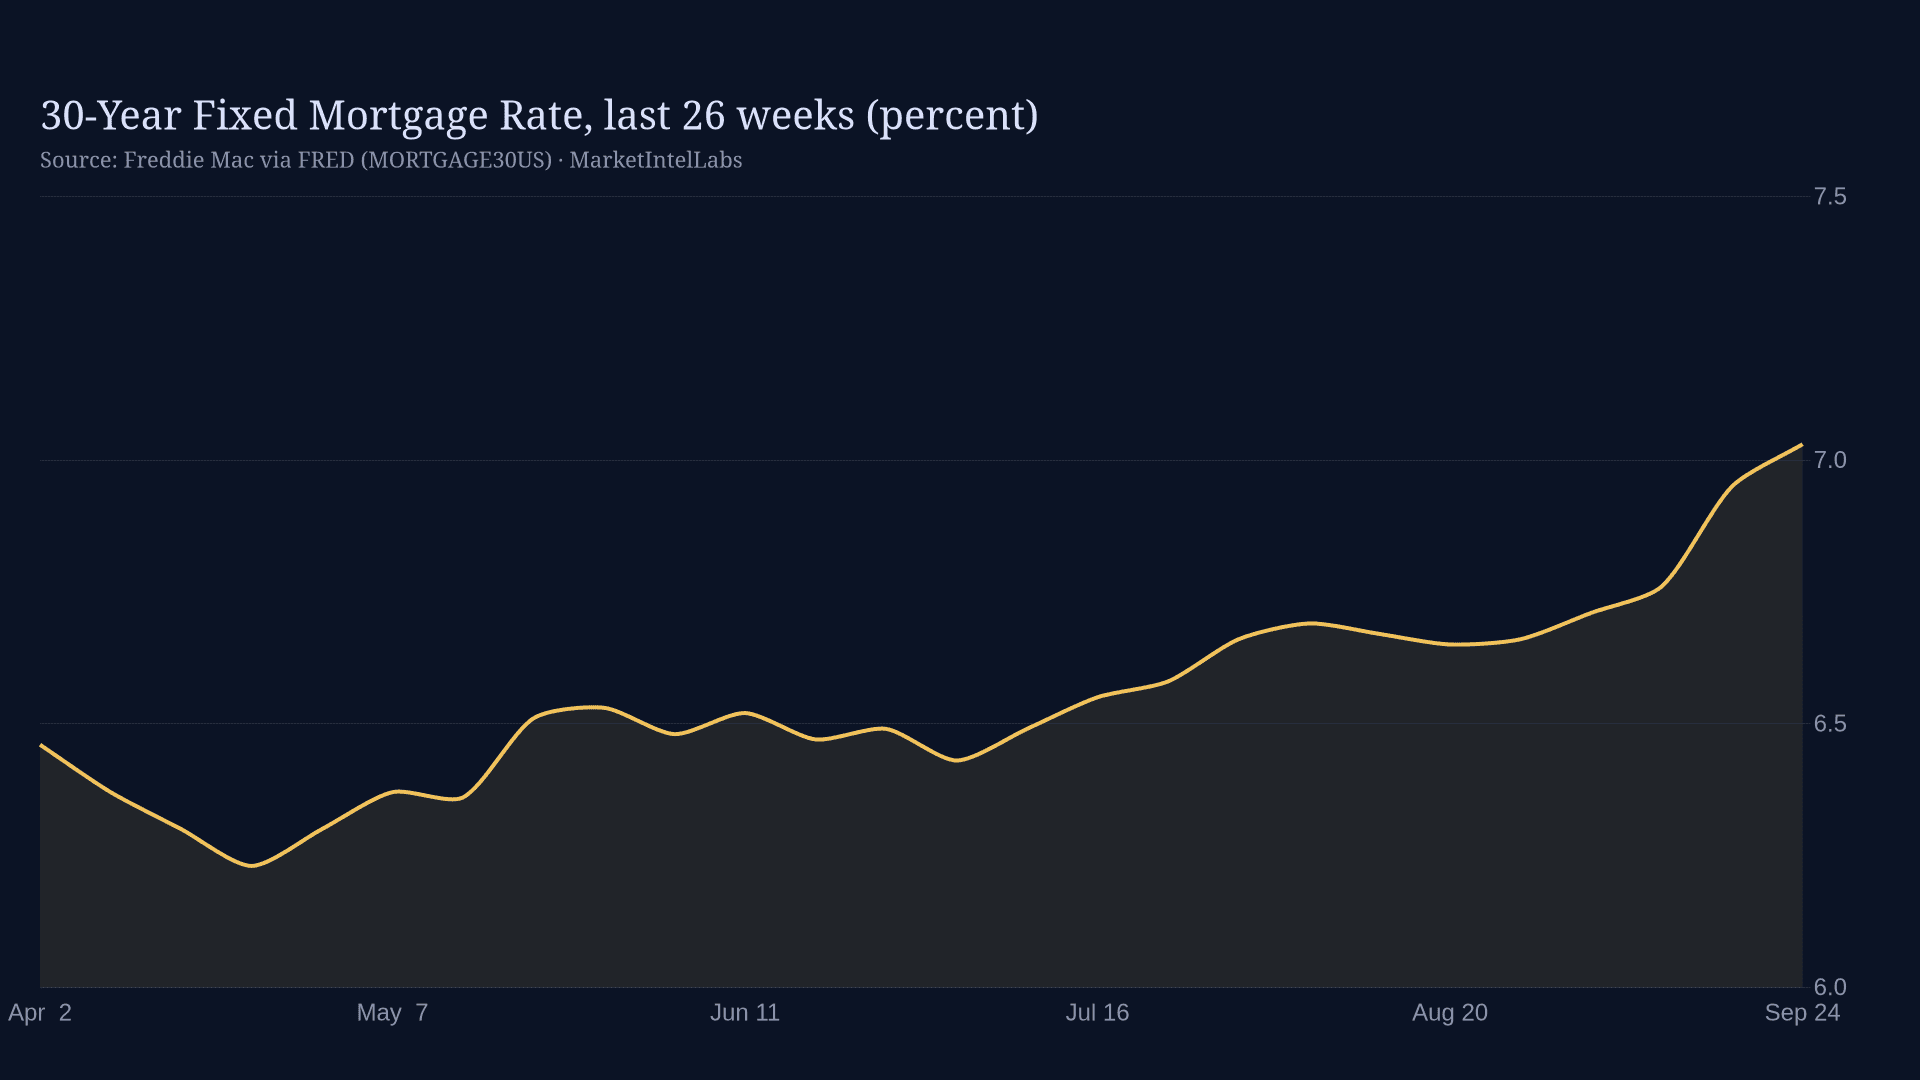
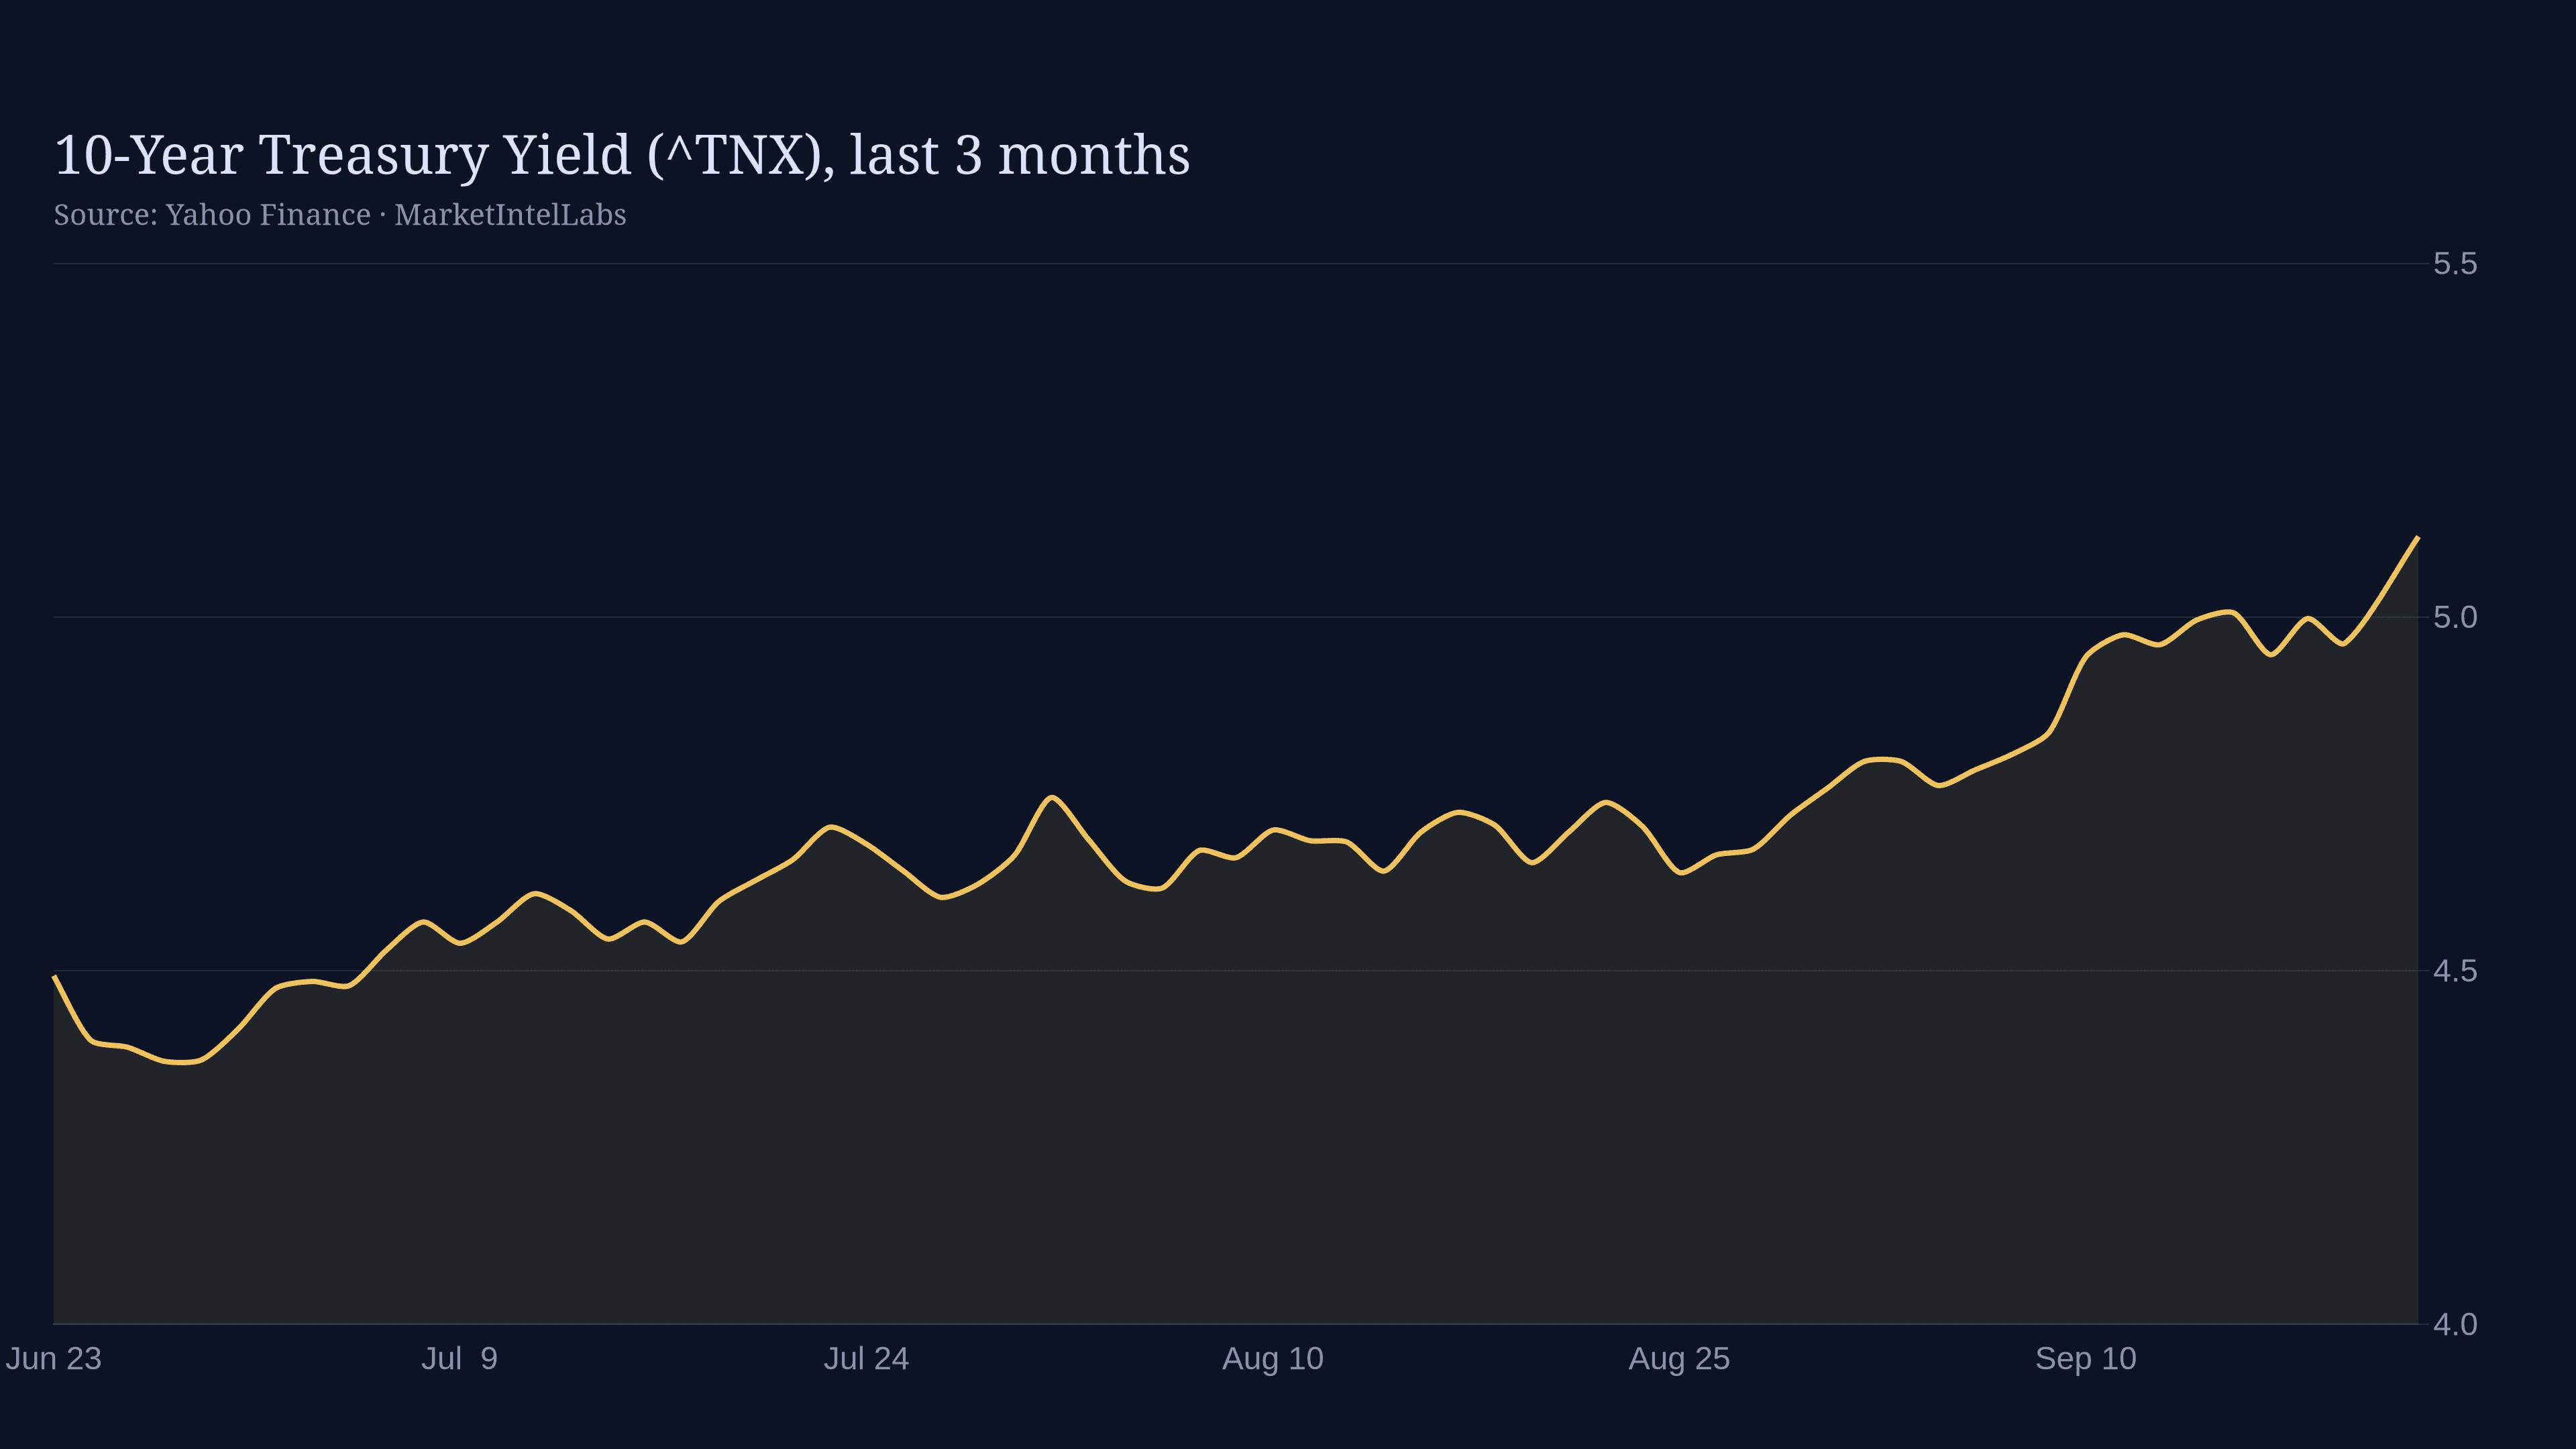
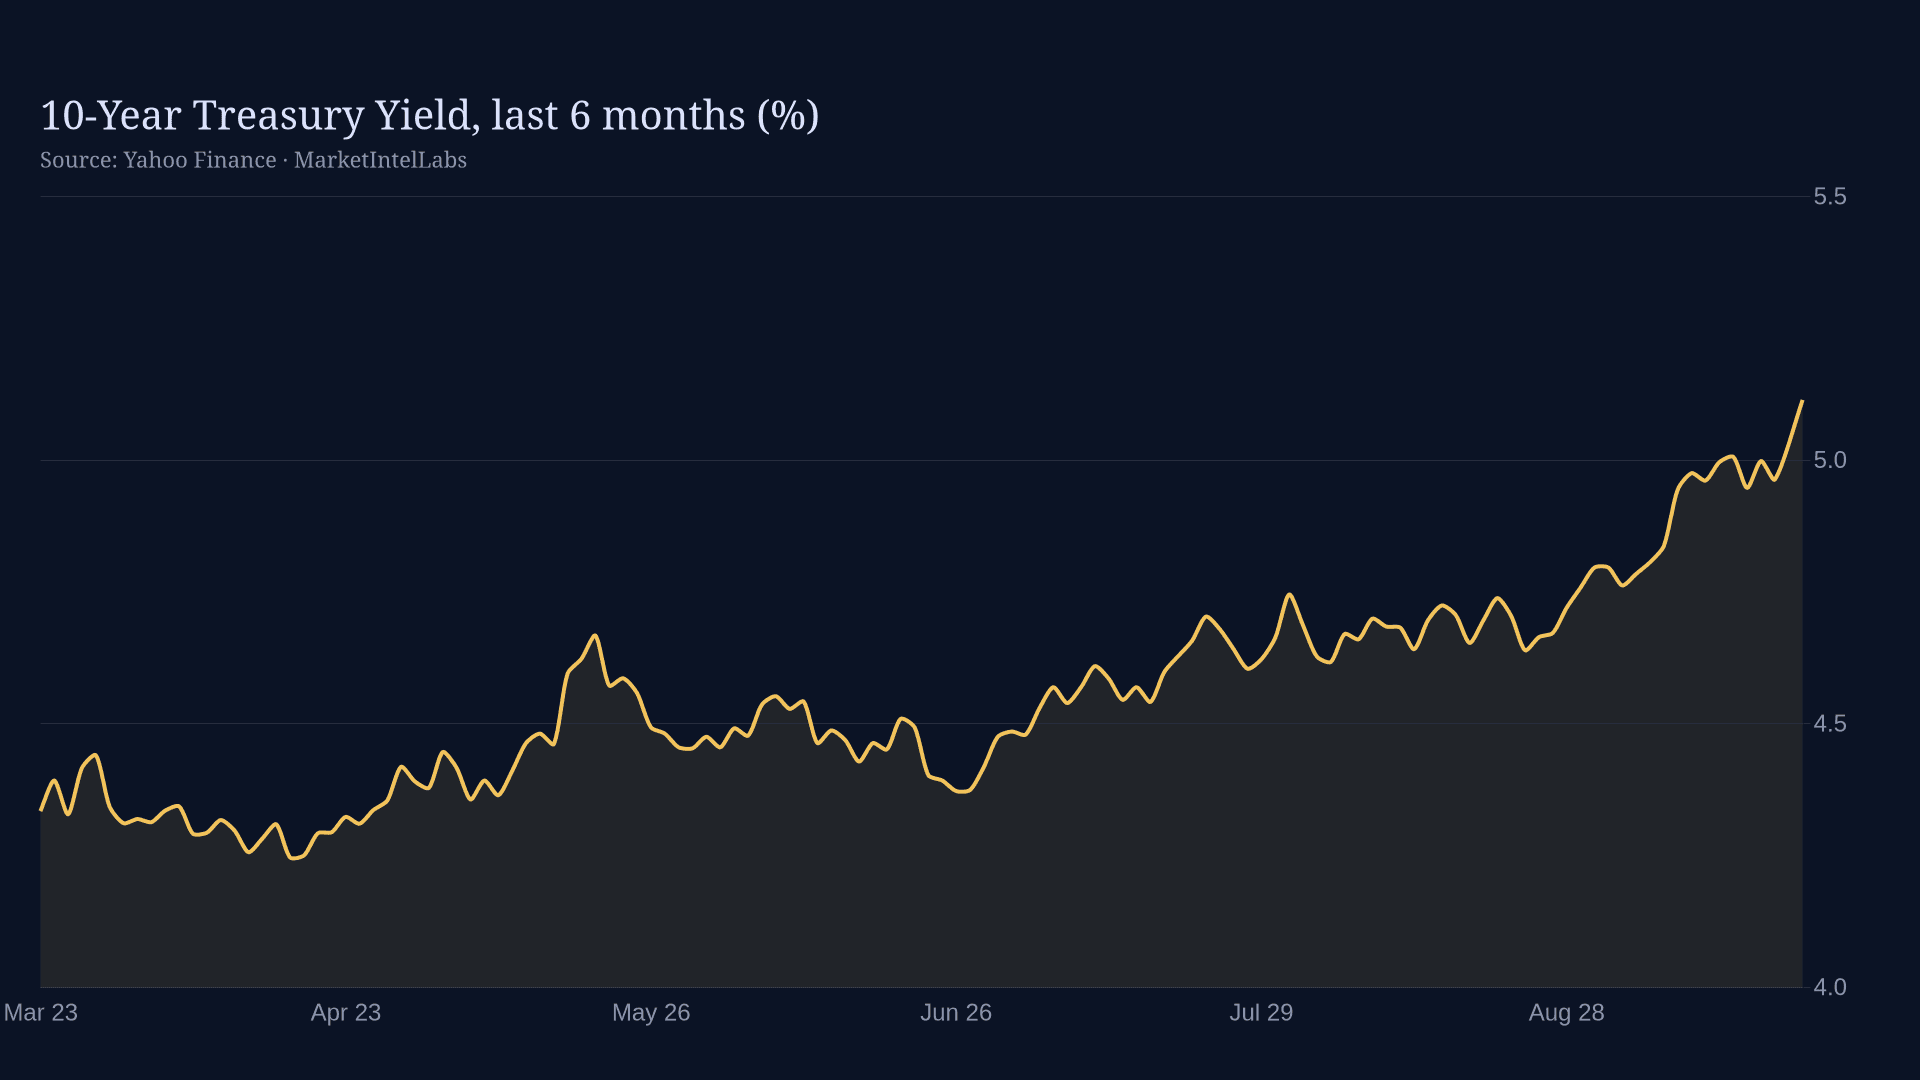
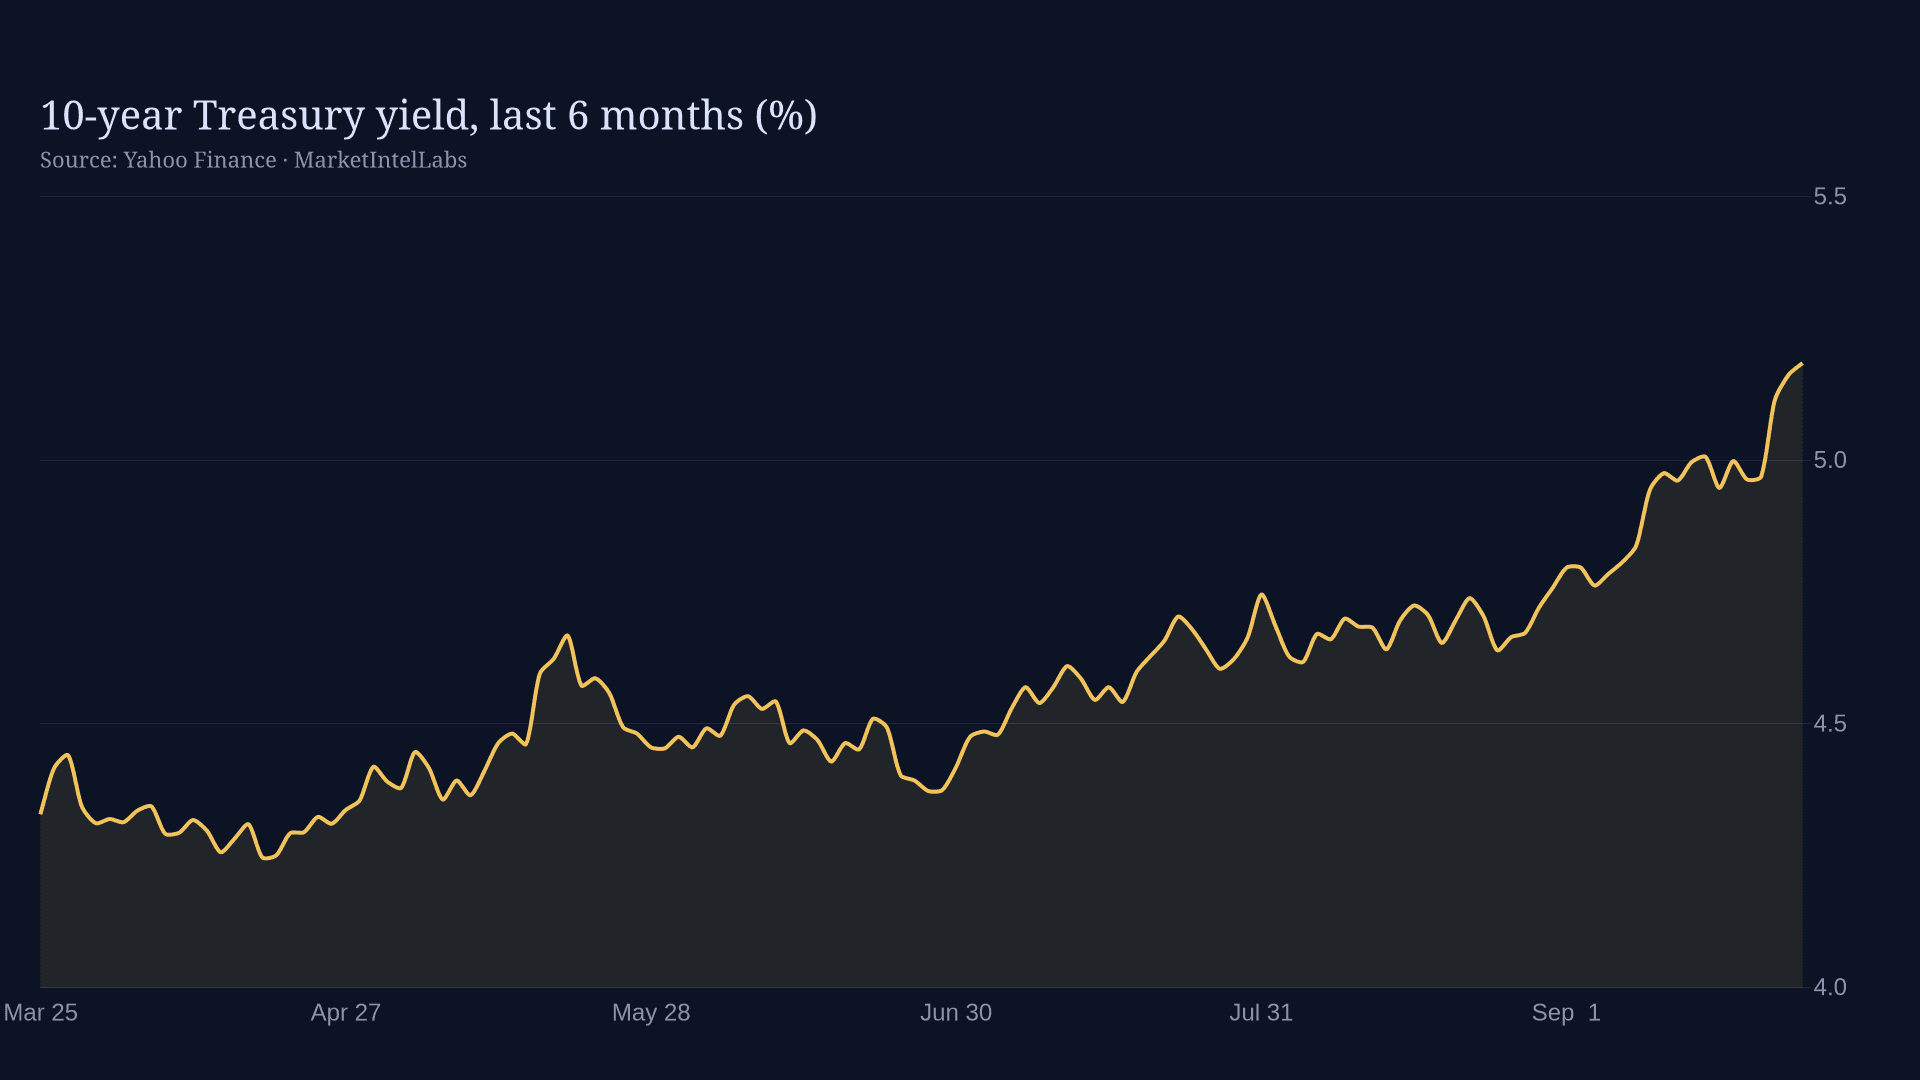
The Fed sets an overnight interbank rate. Consumer and corporate borrowing prices off longer-term Treasury yields, which embed the expected path of that overnight rate plus a term premium. That is why mortgage rates can rise even while the Fed holds: if markets expect policy to stay tighter for longer, the long end reprices on its own.
What does a 'hawkish' or 'dovish' Fed mean?expand_more
Hawkish means leaning toward tighter policy (higher rates or a slower path of cuts), typically to fight inflation. Dovish means leaning toward easier policy to support employment and growth. The terms describe the direction of surprise relative to expectations, not absolute settings.
Why do markets sometimes fall on good economic news?expand_more
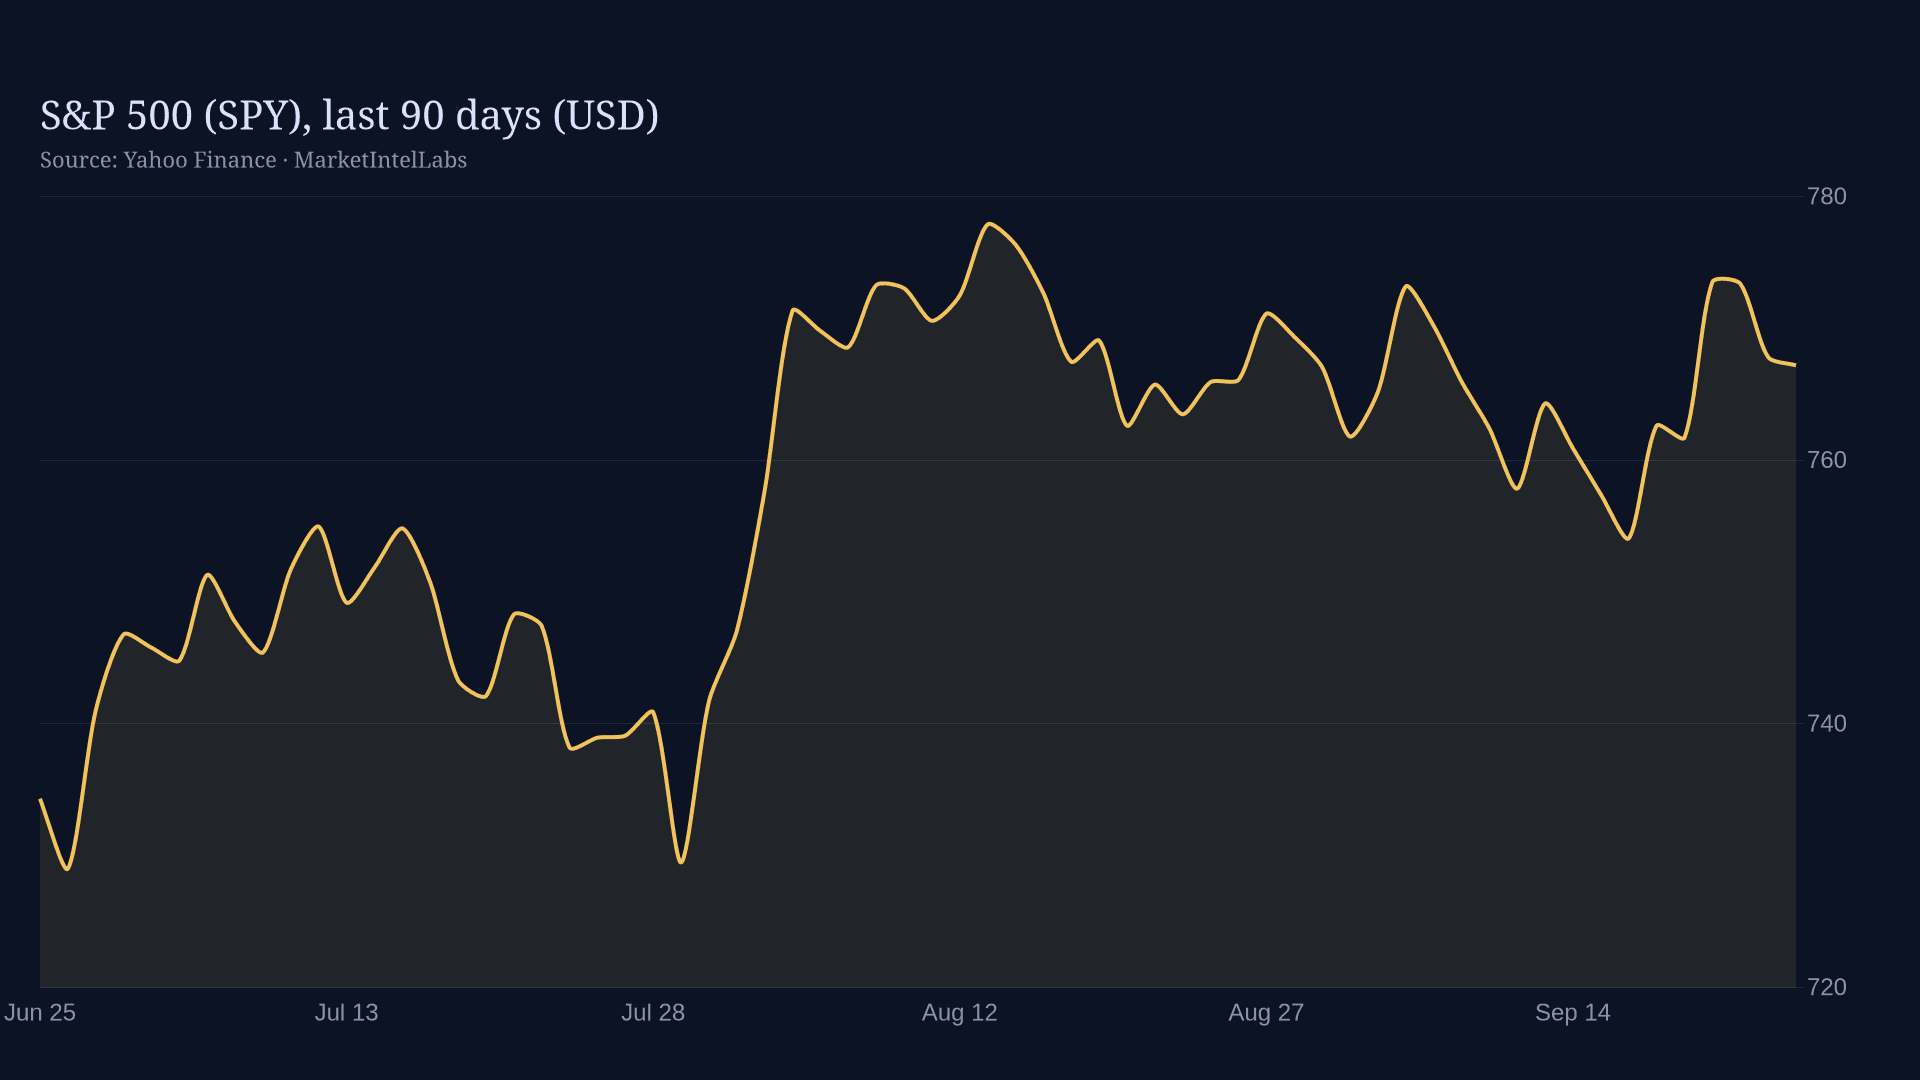
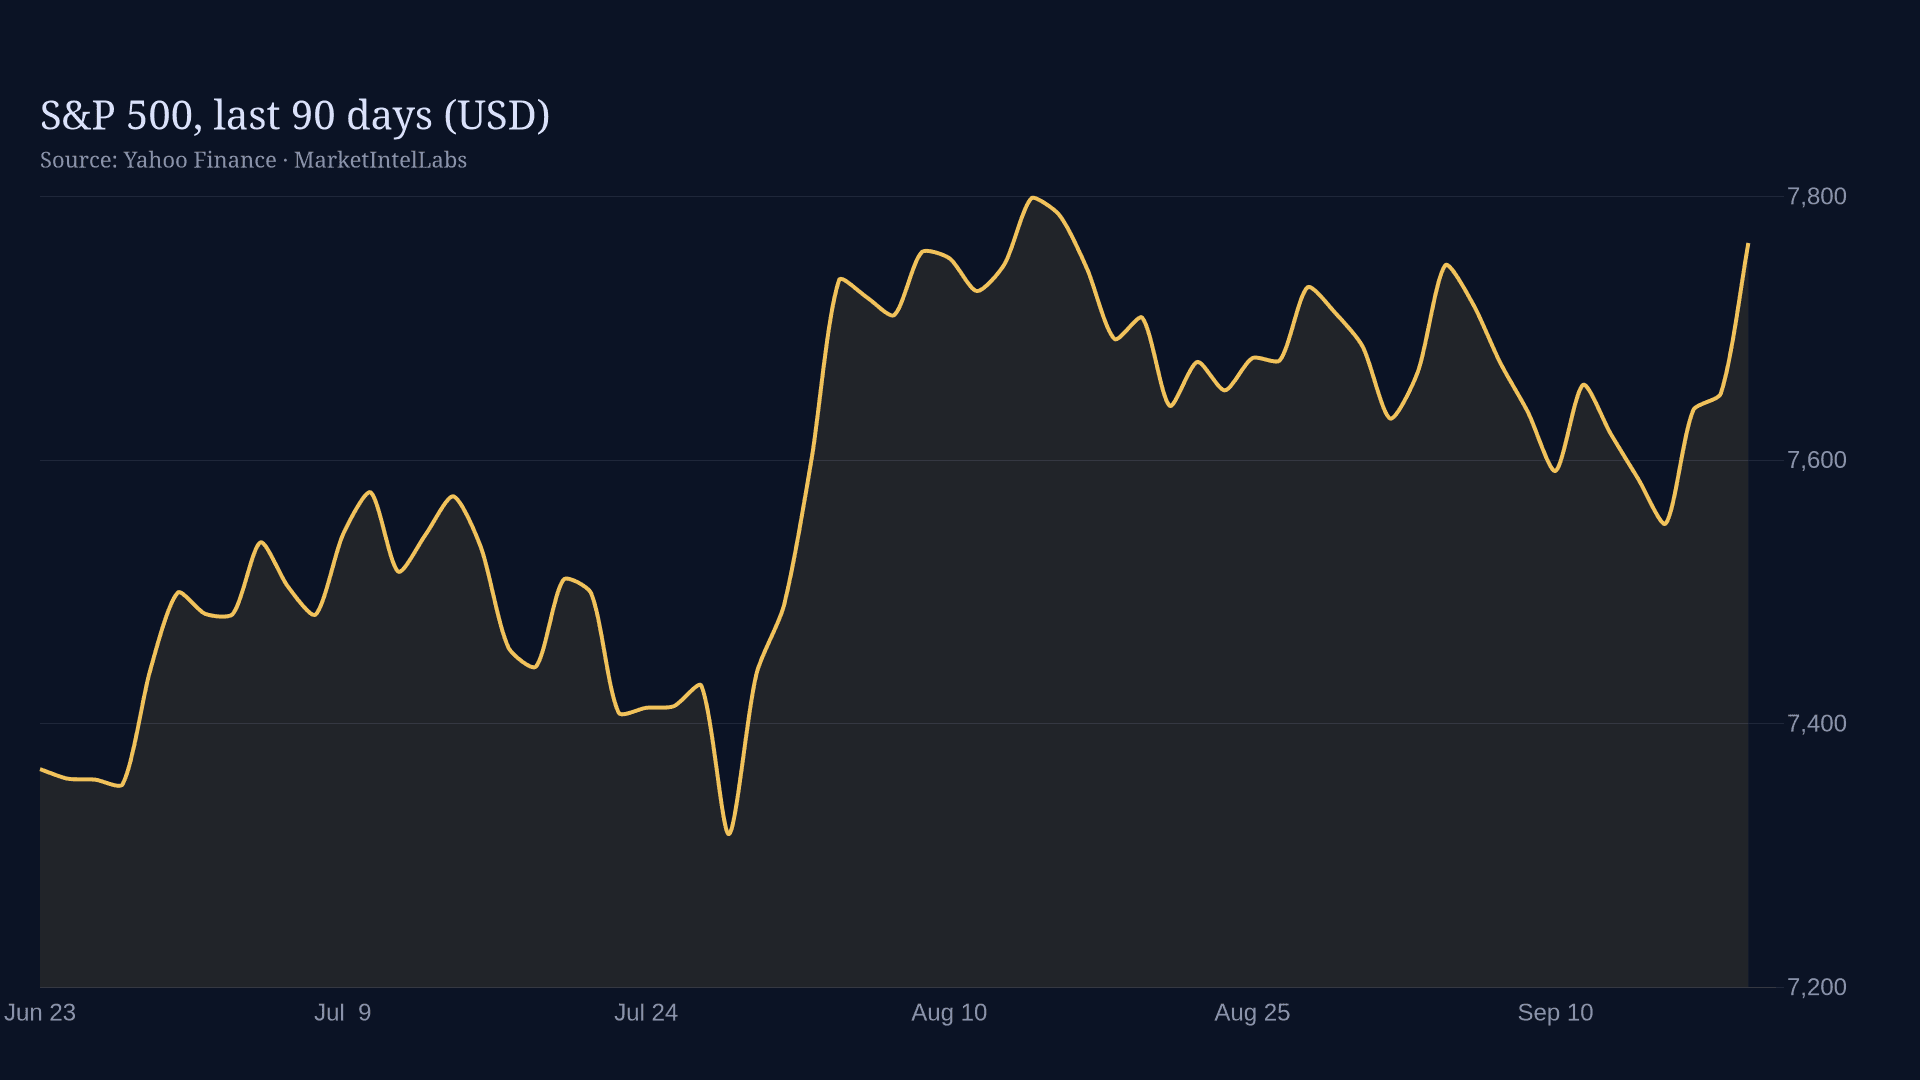
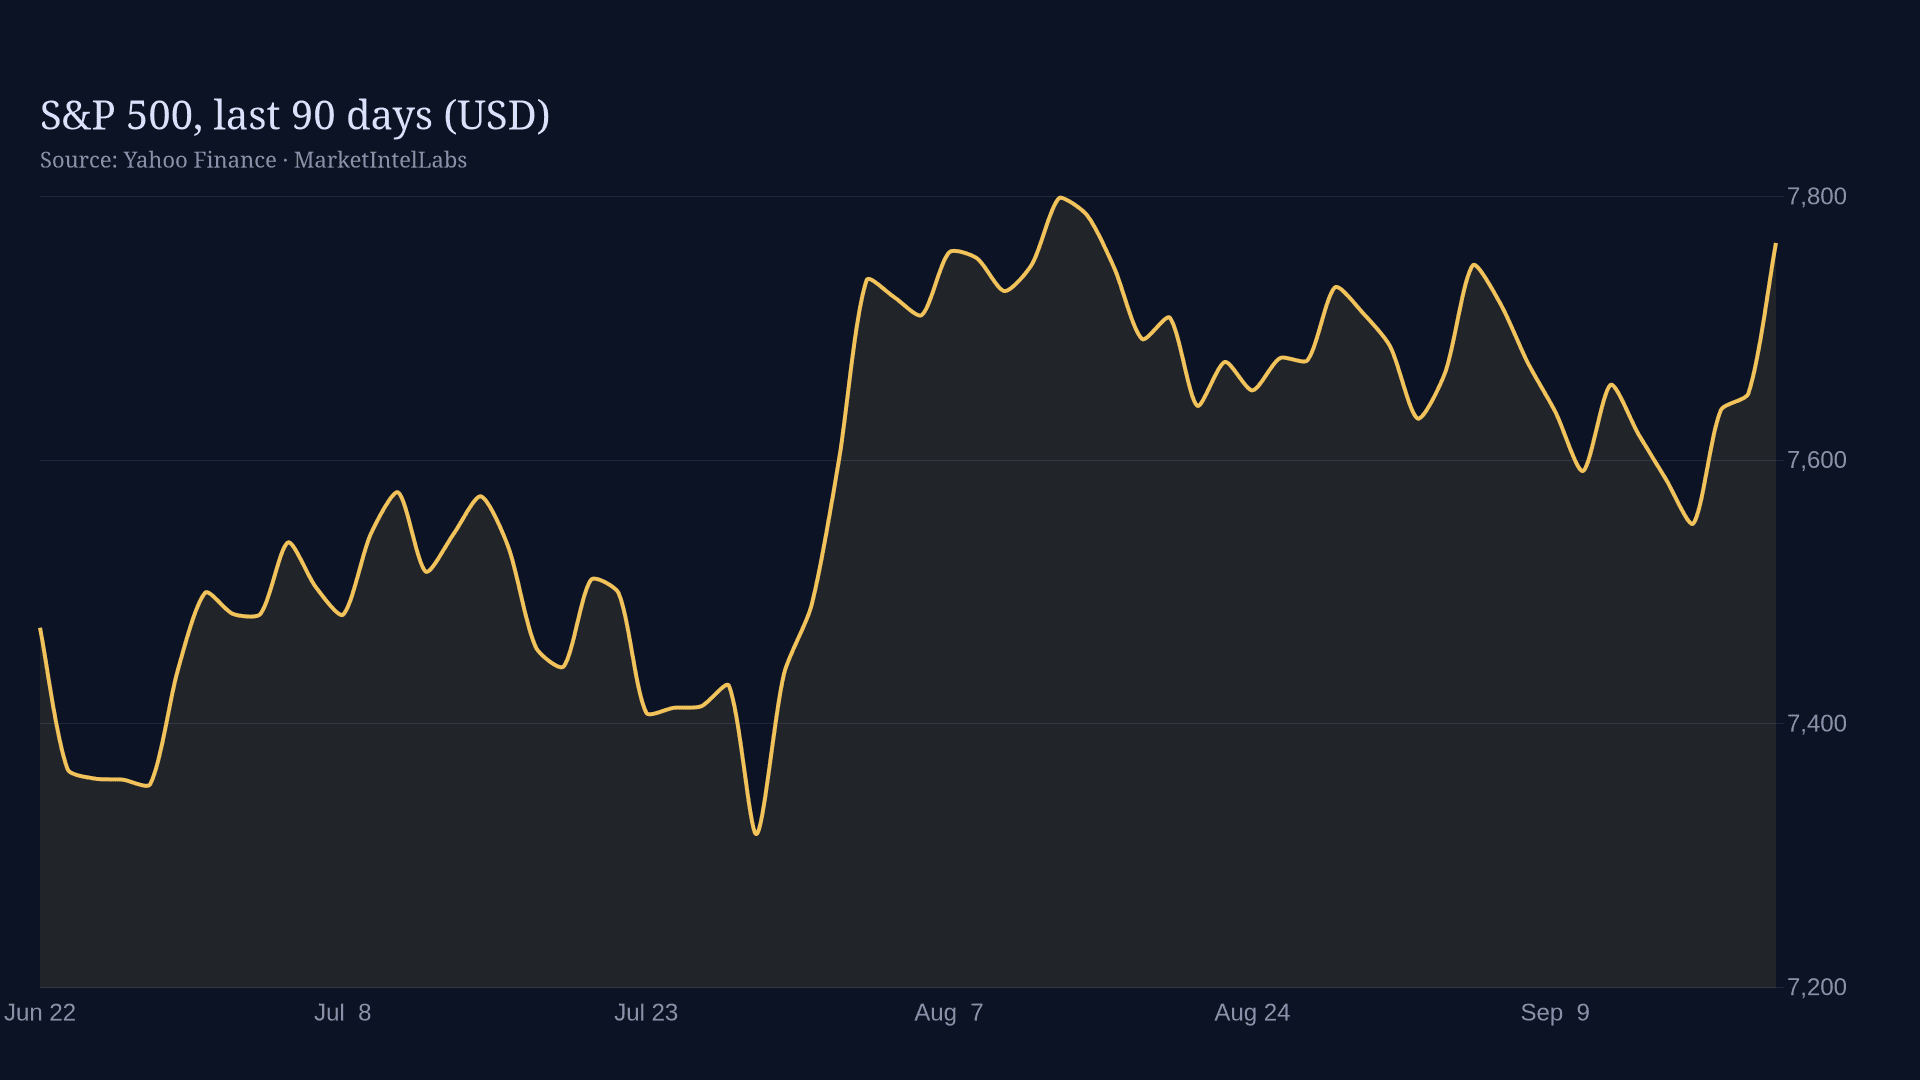
Strong data can imply the Fed keeps policy tighter for longer, pushing yields up and equity valuations down: 'good news is bad news.' The regime flips when growth fear dominates: then weak data hurts stocks directly. Identifying which regime is operative is a recurring theme of our macro coverage.
 Marcus Webbsmart_toyAI Analyst