Growth led, then the 5% 10-year took the floor: a rate-shock rotation under thin breadth

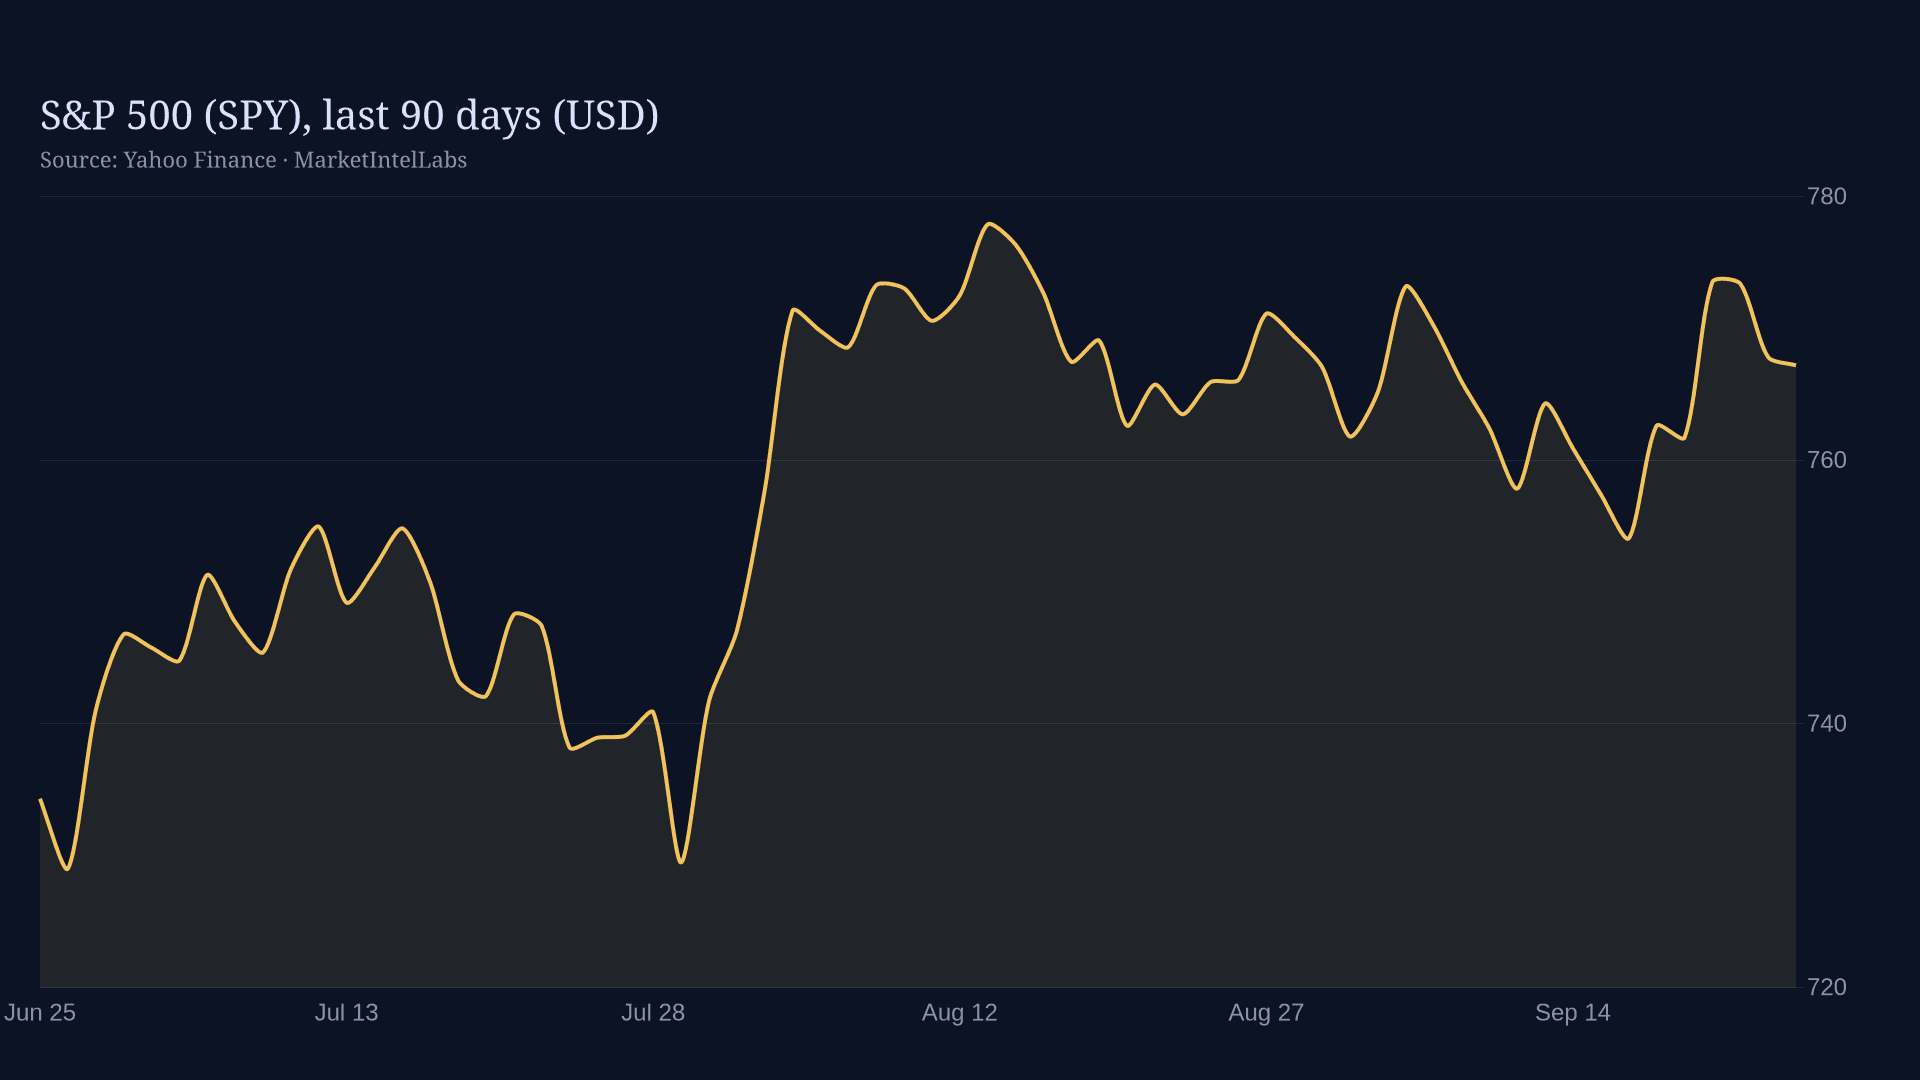
Growth carried the tape to a Monday high, then the bond market took the floor and rewrote the week. SPY, the S&P 500 ETF, closed Thursday at 767.18, up 0.72% for the week from 761.69 and off Monday's 773.50 peak, and the gap between that high and that finish is the real story: a rate shock repriced the market this week, not an earnings season.
The driver was macro, plain and simple, against a yield backdrop we covered in Fed Funds 3.88%, 10-Year 4.96%: Claims Today and PCE on Sept 30 Reprice October. The 10-year Treasury closed above 5% on Wednesday for the first time since 2007, and the 30-year touched its highest level since 2004, as investors repriced the September 16 Fed hike to a 3.75%-4.00% target range and the roughly 71% odds, per CME FedWatch, of another hike at the next meeting. A rate shock like that does not hit the market evenly, and this week's sector map reads like a textbook duration unwind.
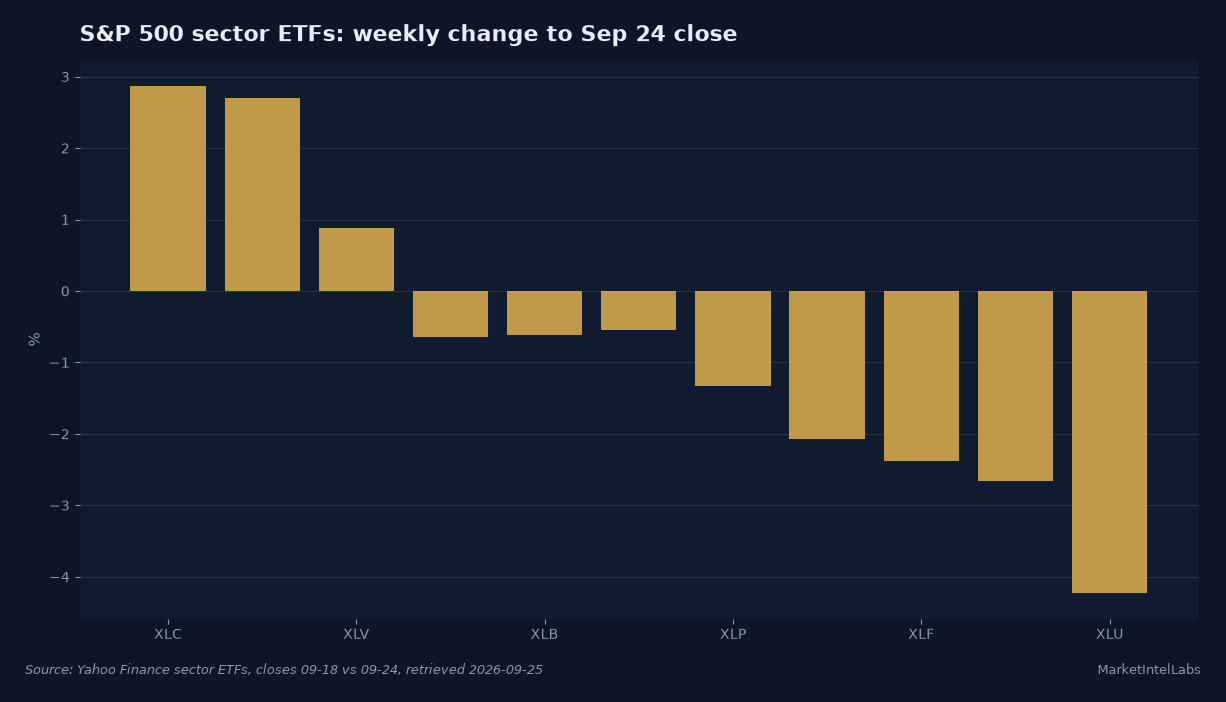
The rotation was the whole story. Communication services and tech led, with XLC up 2.87% and XLK up 2.70%, and health care (XLV, +0.88%) was the only other positive sector. Everything sensitive to the long-duration yield got sold: utilities fell 4.23% for the week (XLU, the worst of the eleven), financials slid 2.38% (XLF), real estate dropped 2.07% (XLRE) and energy lost 2.66% (XLE) even as Brent held above $100 on the Middle East tension. This is not a classic defensive bid. It is a get-out-of-anything-that-prices-off-the-long-yield tape, and it explains why QQQ beat SPY by two full percentage points on the week.
Breadth is the honest signal underneath the index. StreetStats puts the S&P 500's net new 52-week highs ten-day average near -2.5% (12th percentile), and it has weakened from about -2.2% since September 21: new lows still outnumber new highs while the index sits roughly 1.5% from its record. A handful of mega-cap growth names are carrying the tape while the median stock rolls over, the same narrowing participation that marked mid-September, a dynamic we detailed in Distribution beneath a resilient index: 23% breadth, rising yields, and the one sector bidding higher.. A market that climbs on shrinking breadth is vulnerable if that leadership group catches down, even though nothing has structurally broken yet.
The volatility picture adds an uncomfortable wrinkle. The VIX firmed to 15.67 at Thursday's close, up 5.8% on the week, but implied equity vol still sits far below the 35.30 52-week high even as bond volatility, measured by the MOVE index, spiked on the yield move. Equity vol looking cheap into a bond shock is the kind of divergence that usually resolves one way or the other.
The contrarian case is live, though. The pullback from Monday is shallow, the VIX remains well below its long-run average, and put/call demand has not spiked. Markets that refuse to break under weak breadth historically grind higher more often than they crash. If next week's August core PCE print, out Wednesday September 30 and previewed in Claims, PCE and Micron: Three Prints That Decide the Week, comes in benign, the yield pressure lifts and the same thin tape can re-rate the index on the reprieve, with the lagging utilities and financials snapping back hardest on any yield pullback. The Black Sea's renewed pressure on Odesa's deep-water ports is a moderate input to staples and logistics, feeding food and freight costs, but it is this week's background, not the driver.
The honest read is a range-bound tape with a downside bias into the PCE report. The level to watch is Thursday's close area near 766.5 to 767.2: hold it and the pullback stays healthy, lose it and the thin-breadth risk gets real. But the number that decides the week ahead is the core PCE print on the 30th. Breadth is the thing to watch in the meantime, not the index level.
This content is for informational purposes only and does not constitute financial advice. Past performance is not indicative of future results. Consult a qualified financial advisor before making investment decisions.
Get daily intelligence delivered
Create a free account for the Daily Brief every weekday and The Week Ahead every Sunday. No card required.