Distribution beneath a resilient index: 23% breadth, rising yields, and the one sector bidding higher

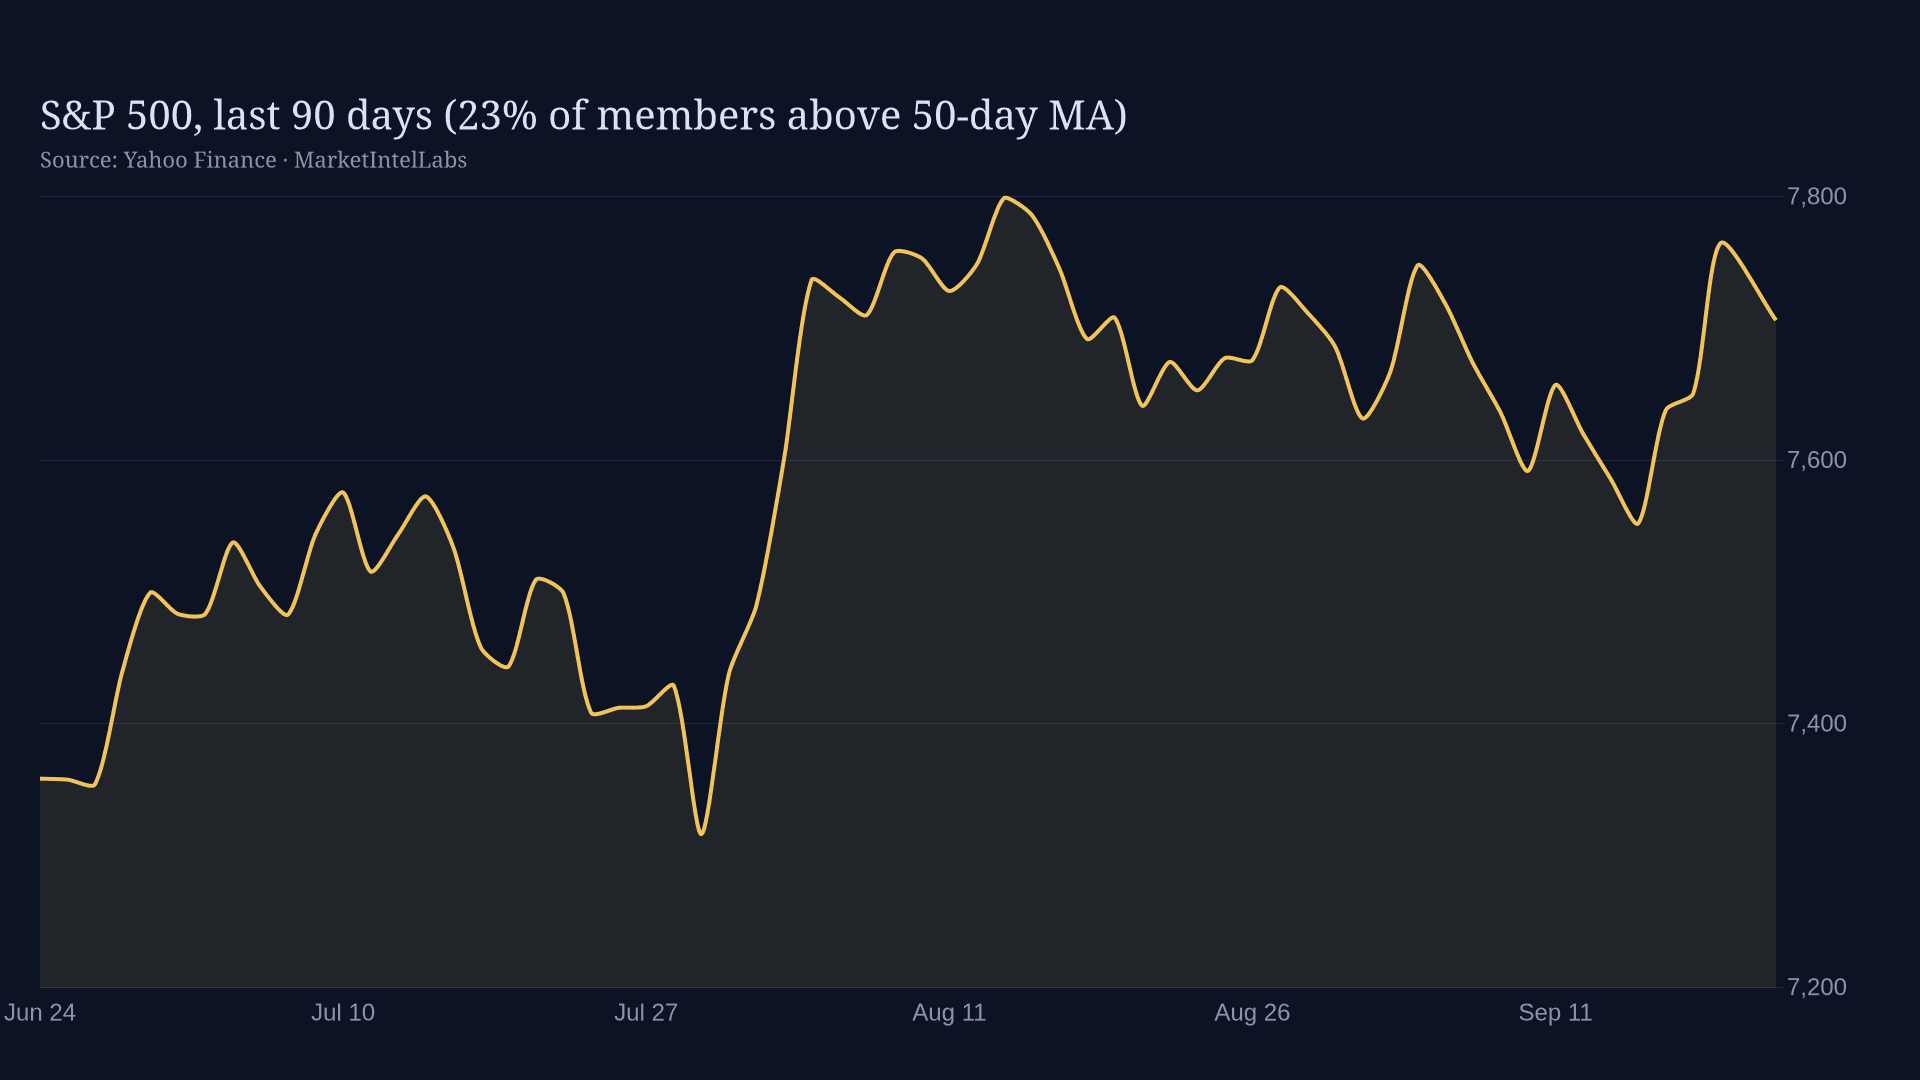
The S&P 500 fell only 0.72% on Wednesday, yet underneath that modest move sat one of the thinnest tapes of this rally: 1,037 advancers against 3,471 decliners, a 23% advance share per TheTrading.Tools breadth data. A resilient index masking broad distribution beneath it is the signal to watch, not the headline number.
Key Takeaways SPY closed Wednesday at 767.81, down 0.72%, but only 23% of stocks advanced (1,037 advancers vs 3,471 decliners), the weakest breadth of an otherwise resilient index. Small caps bore the brunt (IWM -1.84% to 281.92) and rate-sensitive sectors led the decline: utilities XLU -1.92%, real estate XLRE -1.55%, consumer discretionary XLY -1.50%. Energy was the lone green…
Continue reading with Premium
The full equities analysis, with levels, positioning, and what changed, continues below the line.
- checkFull deep-dive reports while they're current: levels, positioning, and conviction scores
- checkWatchlist changes as our analysts make them
- checkExclusive investigative reports
Not ready? Create a free account for extended previews · Already a member? Log in
Secure checkout via Stripe