Weekend Brief: Cash on Top at 5.18% as the 10-Year Clears a 2007 High

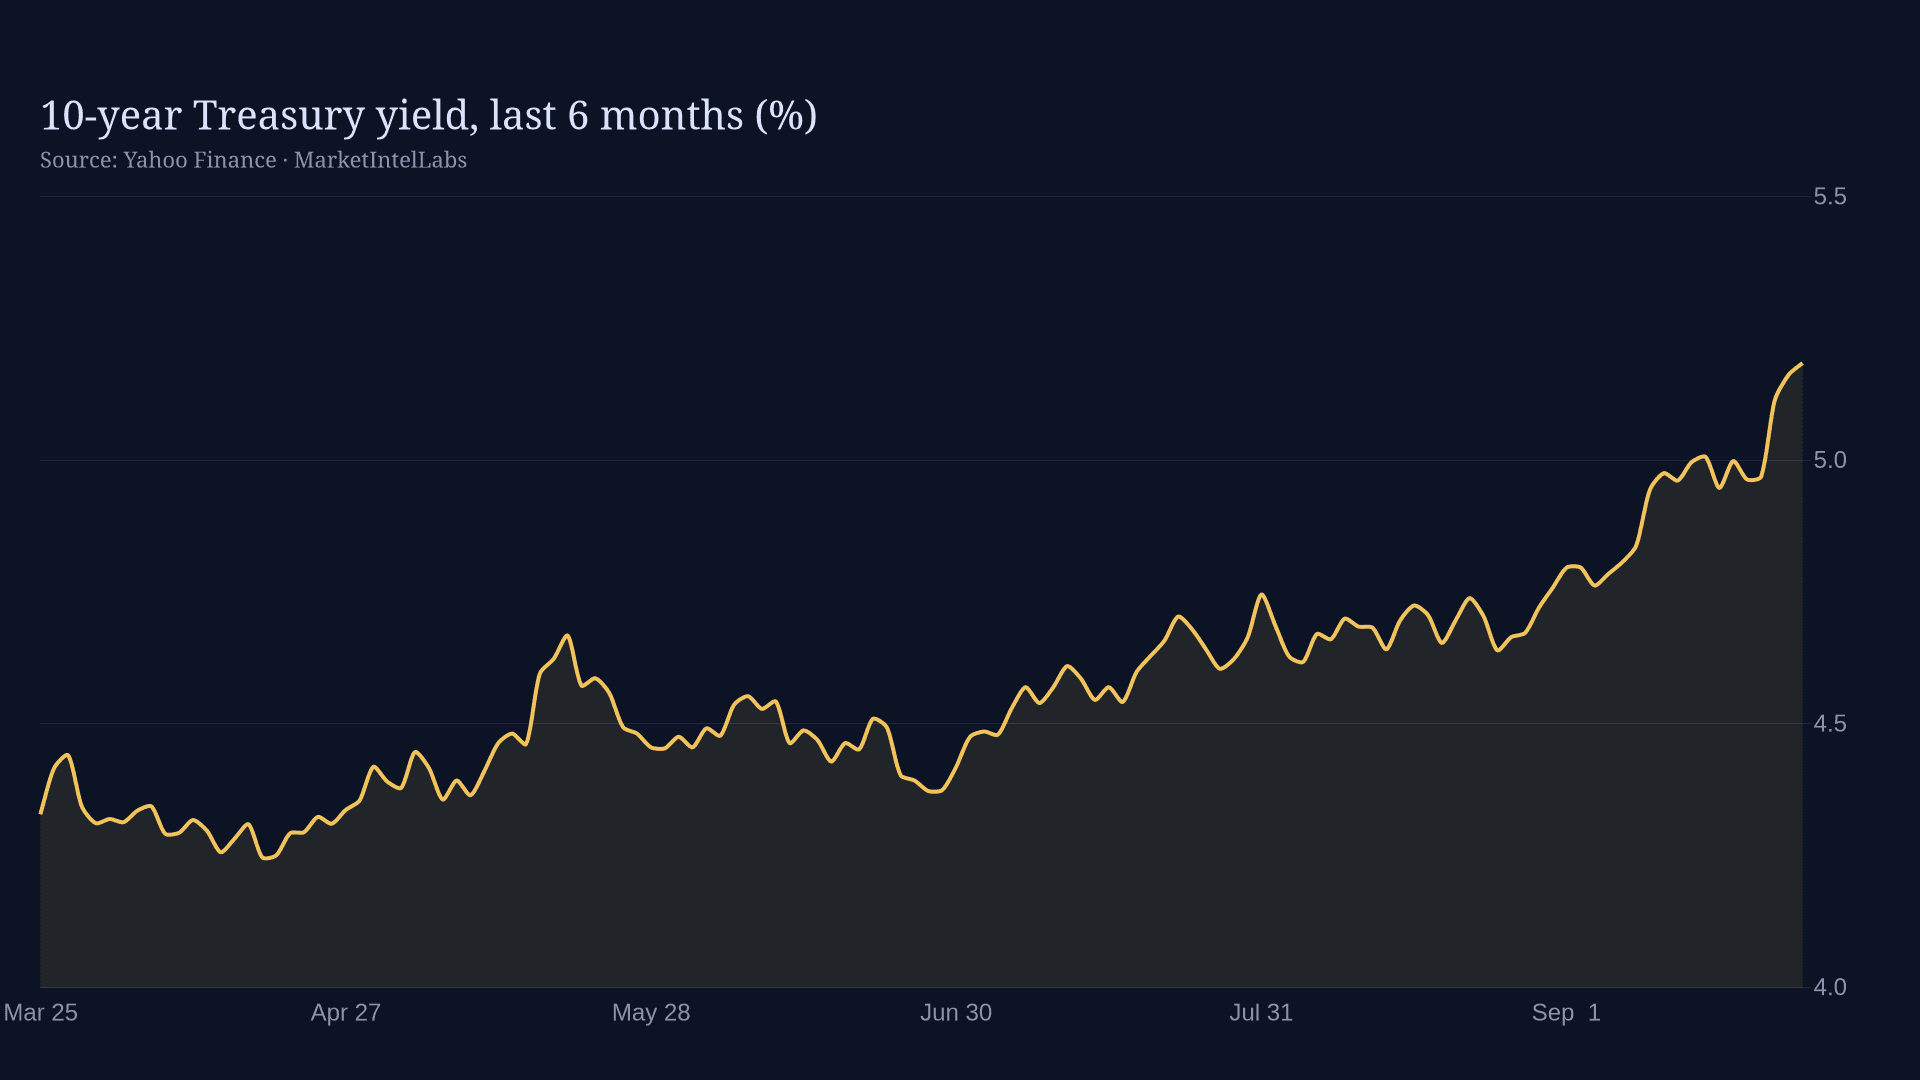
The Fed's quarter-point hike to a 4 percent funds target is the first the Federal Reserve has delivered since 2023, and it is worth slowing down over exactly what that reset did before the next inflation print lands. The 10-year Treasury reached 5.18 percent on September 24, per the Federal Reserve's constant-maturity series, a level the market has seen only once before in the past quarter century. Our The 5% 10-Year Is a Term-Premium Story, Not Just a Fed Story frames why term-premium matters here. The last time yields lived this high was July 2007, the month before the last housing bust began its run at the financial plumbing. Cash now earns real carry, and that single fact is repricing the whole risk stack at once.
The plumbing story under the rate move
A 25 basis point move on its own is small. The funds rate going to 4.00 percent is what the Fed itself communicates through its dot plot, its statement, and its implementation note, and the market read it immediately and sharply. The 10-year jumped from 4.96 percent at the start of the week to 5.11 percent on September 23 and 5.18 percent on September 24, the weekly progression visible in the FRED series day by day.
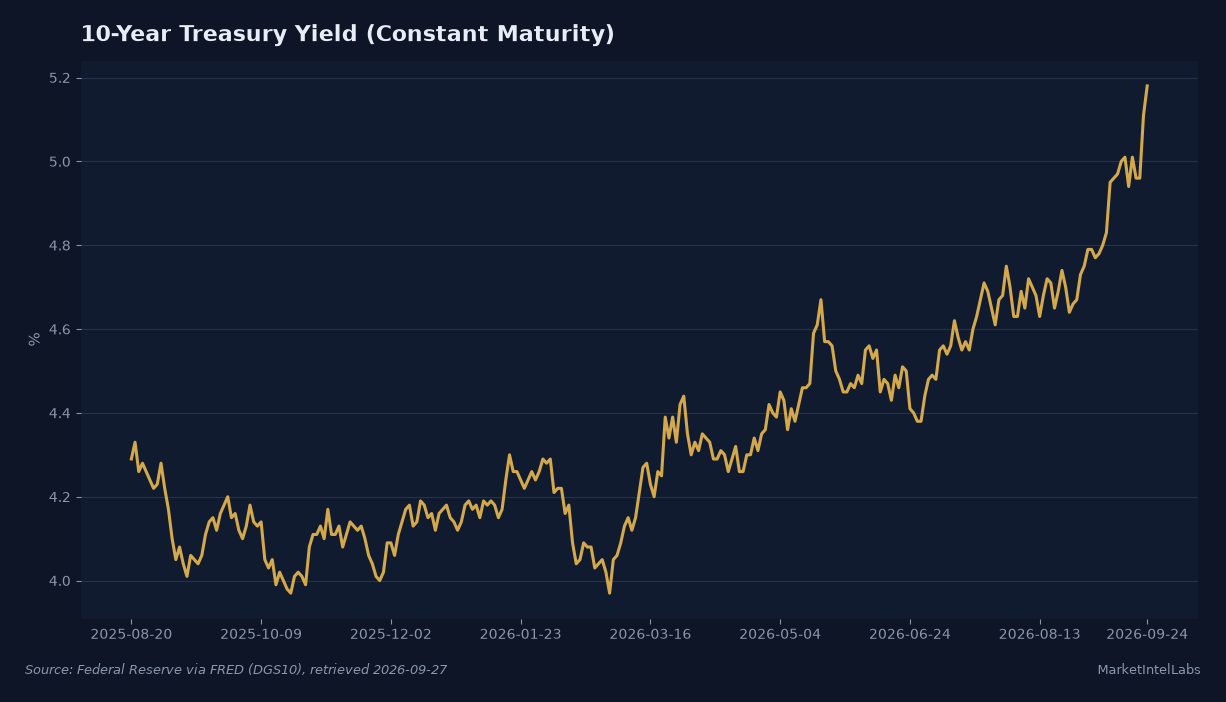
Why does one step up the funds ladder hit the long end this hard? Because a hike after a long pause is not a single data point; it is a change of regime signal. For two years the market could price the funds rate as parked while inflation grumbled underneath. A hike breaks that assumption and says the central bank now believes the path is upward, which drags every longer-dated yield up with it. The 5.18 percent print is a 2007-style level reached off the back of a resume in the real rate cycle, and that is the structural story, not the 25 basis points themselves.
The sequence matters more than any single print in it. Funds at 4 percent flows straight into the money market complex, short-dated Treasury bills roll at the new rate within days, and even a 3-month bill, the instrument the equity risk premium is measured against, reprices off Friday's funding prints almost instantly. Long-duration risk, by contrast, carries a 30-year horizon of uncertainty on top of that 4 percent floor, which is why it absorbs the shock disproportionately.
Cash now carries. A money market fund or short-term Treasury is paying close to the 4 percent funds rate with effectively no duration risk, and that is the anchor that pulls risk assets down. Every dollar that can earn 4 percent overnight with zero volatility is a dollar that no longer needs to reach for a growth stock or a crypto token to beat inflation. The equity risk premium, the compensation for holding duration and default and earnings risk over a Treasury, has quietly compressed because the risk-free alternative got better. That is the mechanism the whole risk stack is repricing around this week.
Money market funds are the quiet winner of this whole move, and their scale is the real story. When the funds rate sits at 4 percent, hundreds of billions of dollars sweep into yield-bearing cash vehicles overnight, and portfolio managers benchmarked to beating cash have to decide whether the equity risk premium still justifies the volatility. At a 2 percent funds rate that decision is easy, risk wins by default because cash pays nothing. At 4 percent the math flips, and every allocation meeting this quarter has to defend holding a long-duration asset against a 4 percent risk-free floor. You do not need a hawkish press conference to see that cascade; you just need the rate.
The asymmetry is the tell: the market refuses to hold the yield where it was even after a modest hike, because positioning had spent two years treating the pause as permanent. Commodity trading advisers and systematic funds had borrowed against a stable short end, and an upward move forces that borrowed positioning to unwind regardless of the equity risk premium. That is why one hike repriced the 10-year by more than 20 basis points in a single week, from 4.96 percent to 5.18 per the FRED series, and why the Fed's next move, a hike or a hold, matters less than whether the direction of yields stays up.
What a resumed real rate cycle actually means
As part of our Fed policy coverage, because this is exactly how it went last time. In 2022 the Fed hiked at speed and the 10-year chased it higher, real yields flipped positive, and the assets with the longest cash-flow horizons fell first. The pause let everyone forget that sequence. This week is a reminder that the sequence itself never expired, only the catalyst did. A desensitized market reacts to the first hike of a resumed cycle the way it reacts to a first hike, hard, because positioning had been built on the assumption that it would not come.
The distinction between nominal and real rates is the piece most retail coverage skips, and it is the piece that matters here. The nominal 10-year at 5.18 percent is the sticker price; the real yield is the sticker price minus expected inflation, and that is the number that does the repricing work. When the Fed started hiking in 2022, real yields rose with it, and every asset priced off a long horizon, from growth stocks to bitcoin to 30-year mortgages, had to be revalued through a higher discount rate. The long pause that followed let that process settle. A hike resumes it, and the market has to redo the arithmetic at the higher end.
The market is telling you it is not done repricing. On Kalshi, the October 25 basis point hike contract cleared 66 cents with 219,000 contracts traded, which is to say traders put roughly two-thirds odds on another move next month, and the December ladder agreed the direction remains up. One hike is a step; a ladder of hikes priced across two meetings is a cycle. The funds market, the short end, and the long end all moved as one this week, which is what a regime change looks like before the press release has finished being quoted.
There is a reread here for anyone who thought the hiking era had closed with the 2023 pause. The Fed held for two years because it chose to, not because it had vanquished inflation. Elevated readings, whichever index the Fed prefers to cite on the day, kept the door open, and an explicit hike announces that the committee now sees the next marginal move as upward. The question the September 30 print answers is not whether the cycle has resumed, the market thinks it has, but how fast it has to run.
AI and tech, risk assets: cash on top
Bitcoin is the cleanest read on the trade. Spot ETFs took in $1.7 billion over two days through the middle of the week, per the daily tracker data, with $609 million of it landing midweek alone, and yet the coin slipped under $84,000 during the week. A $1.7 billion inflow that cannot hold the price above a round number is the market telling you that the marginal seller is the interest-rate shock, not the marginal buyer's conviction. Farside-style flow data shows the buyers, but the broader Treasury move is overwhelming them. A $15.9 billion quarterly options expiry now looms and is exactly the sort of vol event that turns a sideways grind into a direction.
The same logic holds across long-duration equities. Sectors that look like long-duration bonds, high-multiple technology and growth names, get hit hardest when a 10-year at 5.18 percent becomes the discount rate for cash flows that arrive in 2035. Energy, financials, and the rest of the short-duration value complex hold up better because a meaningful part of their earnings shows up this year and next. The rotation we tracked this week, out of growth and into income and value, is the equity market doing its arithmetic on the new rate.
The bull case deserves its own airing, because it is not nothing. The AI capex cycle is real, and sustained investment in data centers, chips, and power is exactly the kind of earnings that shows up in the near term rather than in a 2035 promise, which is why some of the strongest sector reads this week came from the physical side of the buildout rather than the speculative side. A world where capital is genuinely scarce and deployed into physical buildout is not automatically a bear market; it is a rotation. But within AI you still must separate the nearer-term earners, the chipmakers and power providers taking contracted revenue this year, from the longer-dated platforms trading on 2030 optionality, because a 5.18 percent 10-year plugs a discount rate into every valuation simultaneously and the short-duration earners are the ones that survive intact. That is the tension the next week settles: does the yield stabilize, or does it keep ratcheting toward the funding cost that breaks the sensible portion of the stack?
Jobs and sectors
The labor market data this week carried a strange twist. Unemployment fell to 4.1 percent, but before reading that as strength, note the composition: the rate dropped because workers left the labor force, not because hiring accelerated. That is a softness signal wearing a growth costume, and it matters a great deal for the October decision. A hot August PCE reading on September 30 paired with a headline unemployment rate that looks fine but a participation rate that is deteriorating hands the doves little cover to resist an October hike.
This is the tension the September 30 PCE and GDP double will resolve. The Fed has said it needs inflation convincingly on a down path before it stops, and the market, at 66 cents on Kalshi's October 25 basis point contract with 219,000 contracts traded, has already decided the next move is up. A cool PCE print is the only thing that reopens the door to a pause, and even then the December ladder still points higher.
Across sectors the effect is asymmetric, and that asymmetry is the trade. Financials tend to breathe easier with a steeper curve and fatter net interest margins on a 4 percent funds rate. Energy keeps its pricing power with crude holding at $92 and a refinery crack near $98, both flagged in our The September 16 Fed Hike, One Week On: What the Oil and Supply Floor Means for Rates, Gold and Equities Into Year-End, both of which keep the cost-of-living gradients alive. The pain concentrates in the long-duration crowd, the high multiple growers whose cost of capital just went up, and in anything levered to borrowing, which brings us to the mortgage number. New-home sales still cleared at 684,000 in August, per the recent read, but with the 30-year fixed near 7 percent, affordability is doing the slowing for the Fed, and that is a real transmission channel the committee is watching alongside the inflation prints.
Security and sanctions
One thread ties the dollar plumbing to the rate story and is worth holding separately. Ukraine faces a roughly $27 billion financing shortfall into October, against the backdrop of what is now widely reported as about EUR 210 billion of Russian assets frozen at Euroclear. The architecture that freezes those assets and holds them in dollars and euros only works while the rest of the world is willing to hold Western reserves and pay the West's rates. A 5.18 percent 10-year raises the cost of that arrangement for everyone holding Treasuries, friend and sanctioned alike, and it is the quiet pressure point under any sanctions architecture. This week the rate move is the bigger story; the shortfall is the standing backdrop.
What it means for your money this week
September 30 is the pivot. Both readings, August PCE and the revised second-quarter GDP, publish that morning, and the market has effectively pre-traded an October hike into the 66 cent level. Practical setup in a high yield world: cash and short-duration instruments are earning carry right now with no risk premium asked, and there is no reason to reach for duration or for levered risk until the data says the yield peak is behind us. Risk assets can grind higher off inflows, as bitcoin's $1.7 billion inflow week showed, but a high and still-rising 10-year caps the upside until it stabilizes. Watch the yield, not just the headline index.
The bear case is not contrarian, it is just worth stating plainly. If PCE prints hot on September 30 and the 10-year pushes through 5.25 percent toward the 5.26 percent 2007 peak, the discount rate reaches the level where leveraged carry trades and the riskiest tranches of the equity stack start to break mechanically, not just drift lower. Nothing about the current setup rules that path out. The bull case rests entirely on the yield stabilizing, and stabilization is a judgment call the data, not the narrative, gets to make.
On the desk calendar this week: the Cost of Living desk is watching diesel at a record $6.53 and what a 7 percent 30-year mortgage does to the household bill, Supply Chain is tracking the freight and tanker rate signals, and Prediction Markets is watching the Kalshi ladders around the September 30 PCE print. Ukraine's $27bn October cliff meets frozen EUR210bn ties the frozen-asset architecture to the rate cycle, and the desks have the week ahead wired from the consumer side of the same trade.
This content is for informational purposes only and does not constitute financial advice. Past performance is not indicative of future results. Consult a qualified financial advisor before making investment decisions.
Get daily intelligence delivered
Create a free account for the Daily Brief every weekday and The Week Ahead every Sunday. No card required.