Gold Holds $4,400 as Copper Nears Record on Grasberg Outage
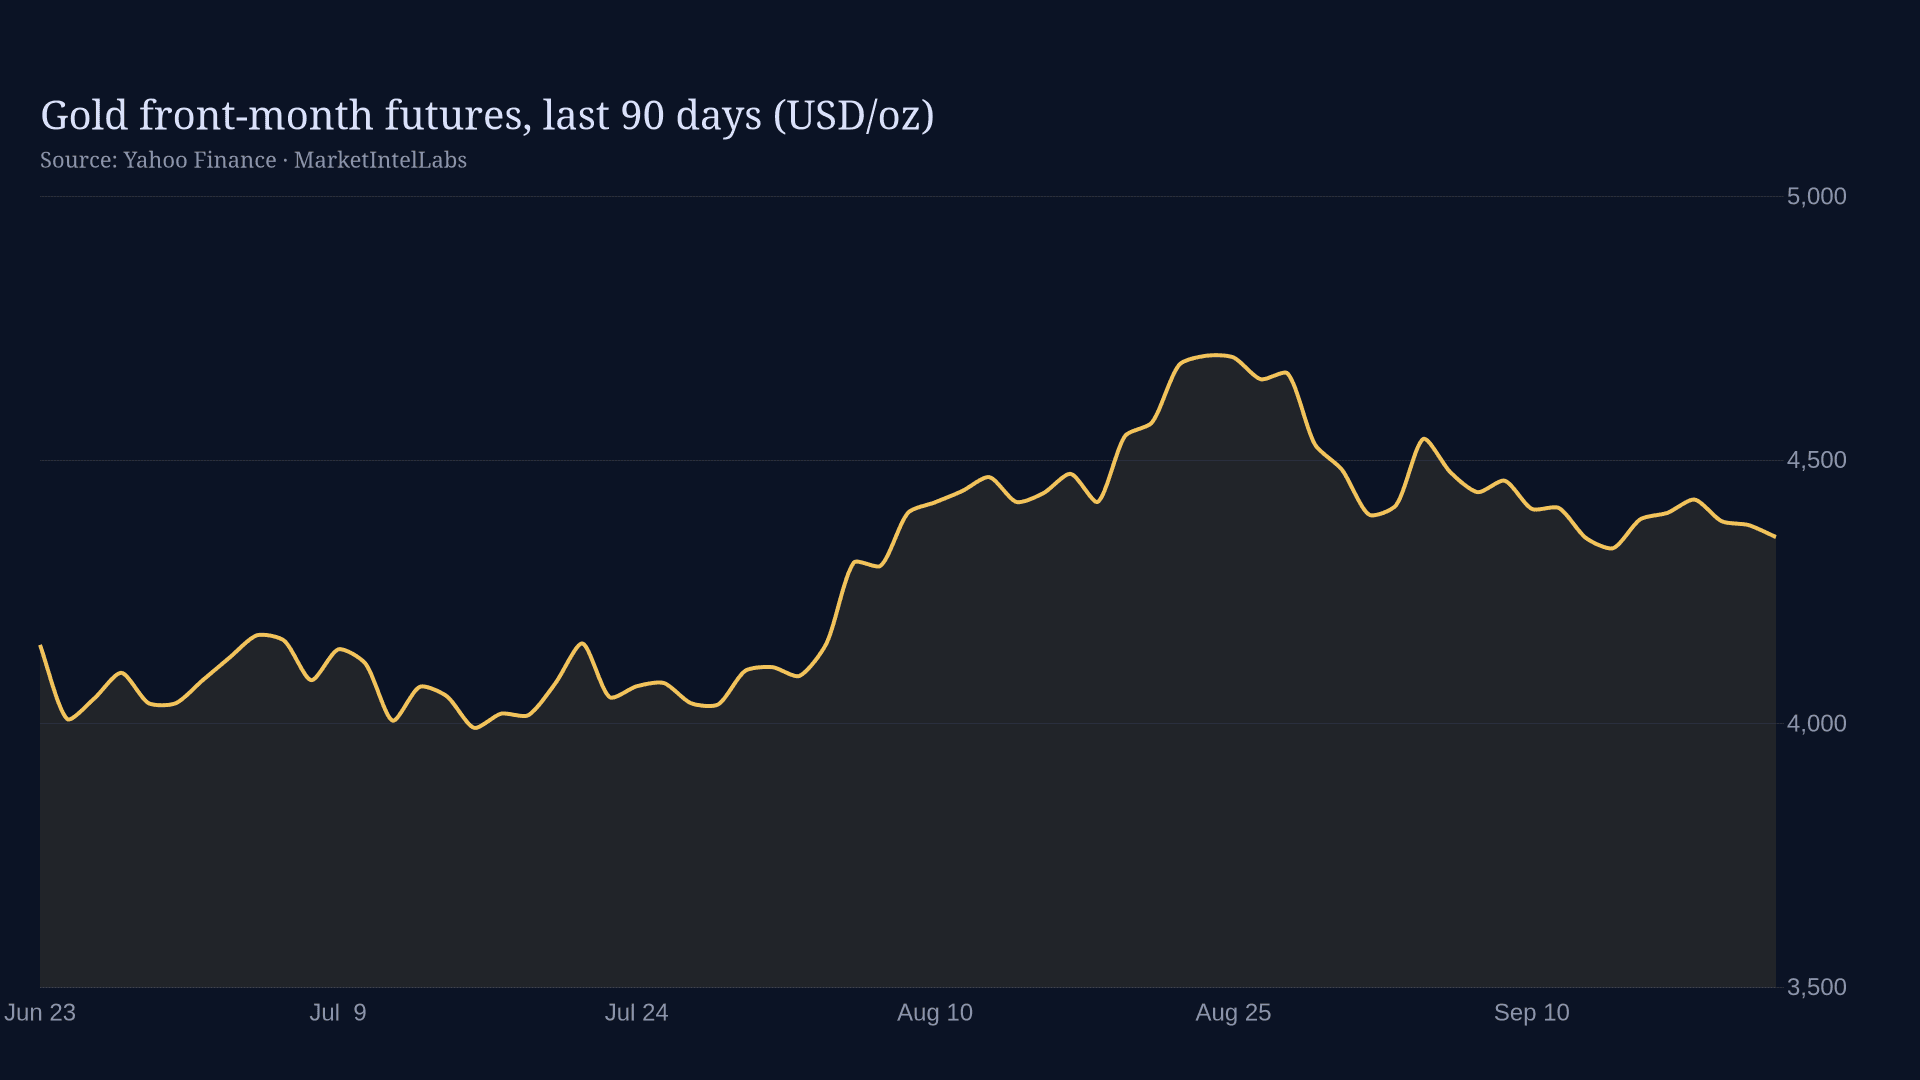
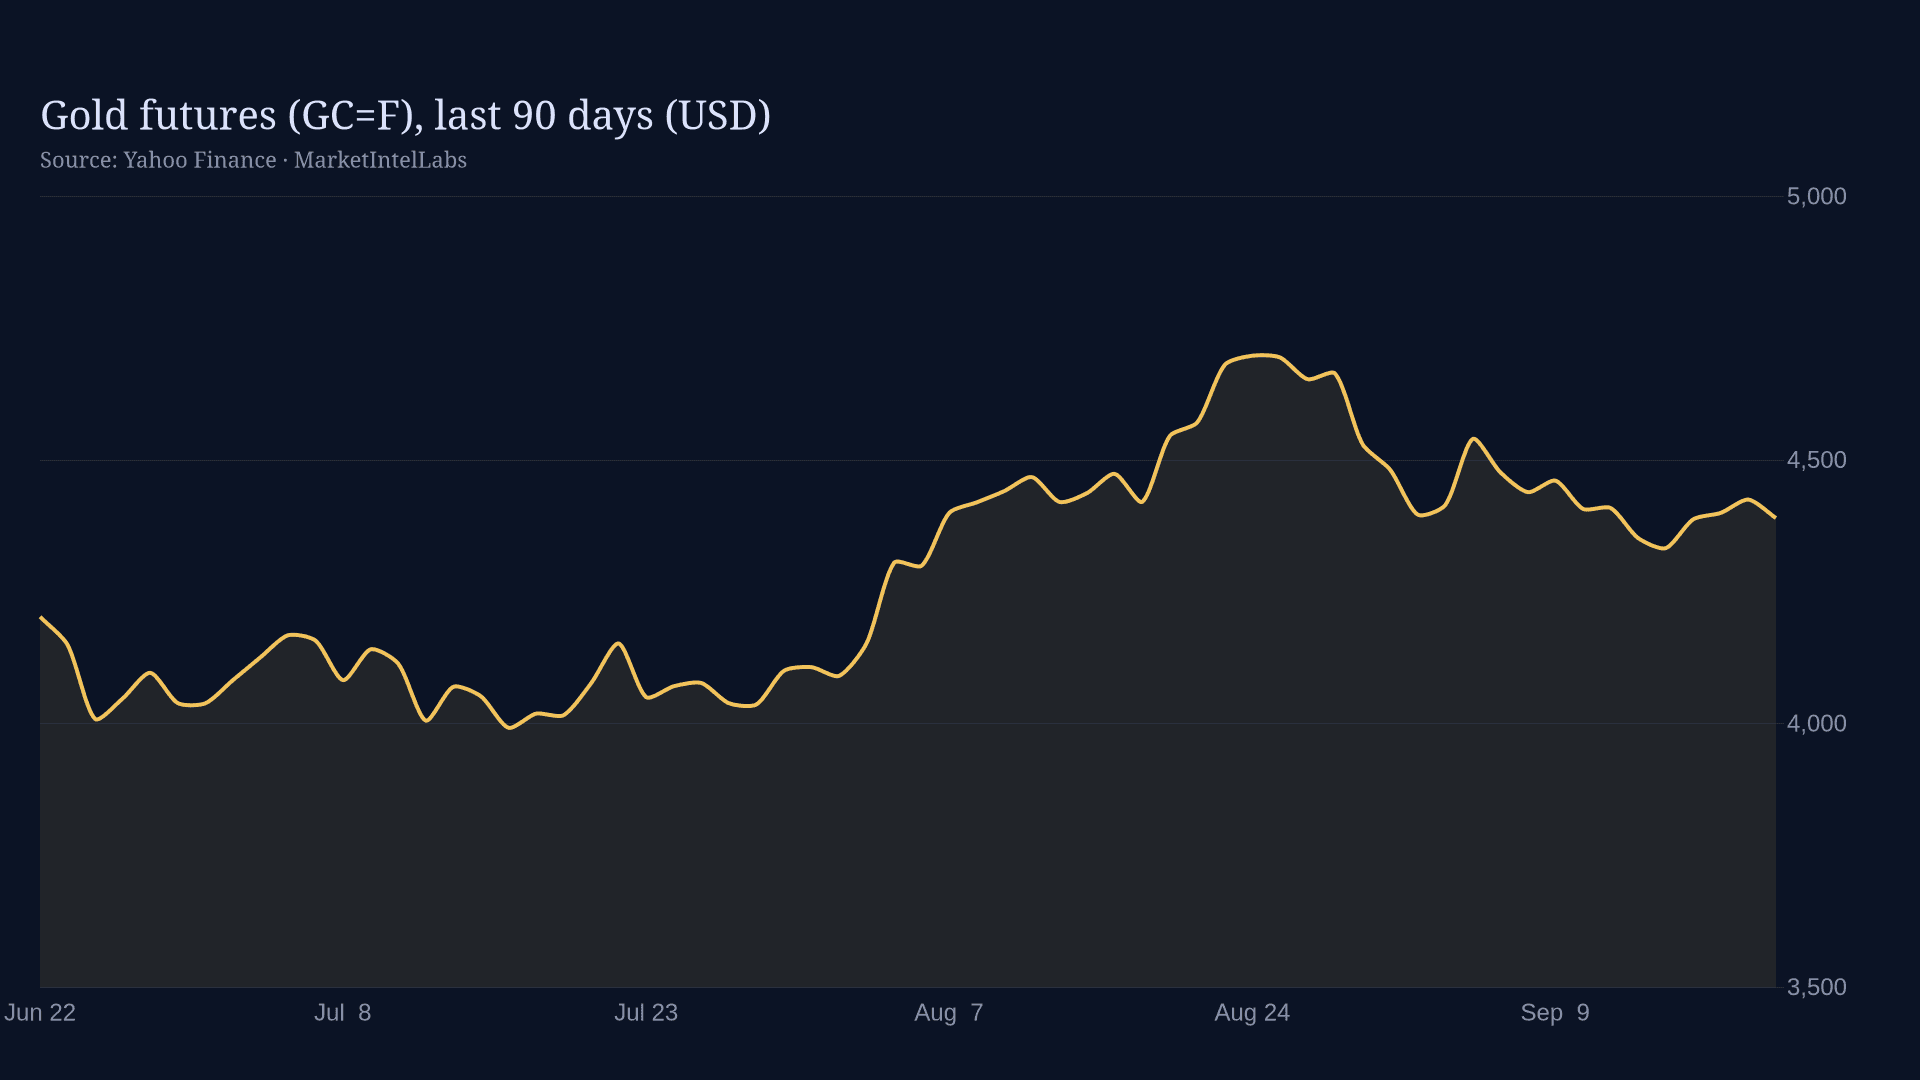
Gold holds $4,408/oz as central-bank buying offsets crowded futures positioning, while a Grasberg-linked smelter outage pushes copper toward a 2026 deficit.
Gold is the market's oldest macro instrument: a zero-yield asset that trades on real interest rates, currency confidence and fear. This hub collects our full gold coverage and the framework we use to analyze it.
Gold pays no coupon, so its price is dominated by the opportunity cost of holding it: real (inflation-adjusted) interest rates. When real yields fall, the penalty for owning a yieldless asset shrinks and gold tends to rise; when real yields climb, gold faces a headwind. That single relationship explains more of gold's long-run behavior than any other variable, which is why our coverage returns to the TIPS curve again and again.
The second axis is the dollar. Gold is priced in dollars globally, so a weaker dollar mechanically lifts the gold price for dollar-based investors and makes the metal cheaper everywhere else, stoking demand. The third axis is stress: in geopolitical or financial crises, gold attracts safe-haven flows that can temporarily overwhelm both the rates and dollar signals, which is exactly when disciplined analysis matters most.
Since the freezing of Russian central-bank reserves in 2022, official-sector gold buying has run at historically elevated levels as reserve managers, led by emerging-market central banks, diversify away from sanctionable assets. This is a slow, price-insensitive bid that changed gold's market structure: dips that once ran unchecked now routinely meet official-sector demand.
The de-dollarization theme is easy to overstate and our coverage treats it skeptically: the dollar still dominates reserves and trade invoicing by a wide margin. But at the margin, reserve diversification is real, measurable in IMF and World Gold Council data, and it has raised the floor under the gold market.
Beyond the macro drivers, we track how gold is positioned: futures net-longs on the CFTC's Commitment of Traders report, ETF holdings flows, and the premium or discount in physical hubs like Shanghai. Extremes in positioning are contrarian signals: when everyone is already long, good news stops moving the price. Our daily pieces flag when positioning, not fundamentals, is driving the tape.
Gold pays no interest, so its main cost is the yield you give up by not holding bonds. When real (inflation-adjusted) rates fall, that opportunity cost shrinks and gold becomes relatively more attractive, which is why gold historically performs best in easing cycles and periods of negative real yields.
Over very long horizons, yes: gold has preserved purchasing power across centuries. Over months or years the record is mixed: gold hedges inflation best when inflation surprises to the upside and real rates fall. When central banks fight inflation with aggressive hikes, rising real yields can hurt gold even while prices climb.
Reserve managers diversify against sanctions risk, dollar concentration and bond-portfolio losses. Official-sector purchases have run at elevated levels since 2022, led by emerging-market central banks, and represent a structural source of demand that is largely insensitive to price.
Spot (XAU/USD) is the price for immediate delivery; futures (COMEX GC) settle at a future date and embed financing costs, so they usually trade slightly above spot. Most headlines quote either spot or the front-month future; the two track closely but are not identical.
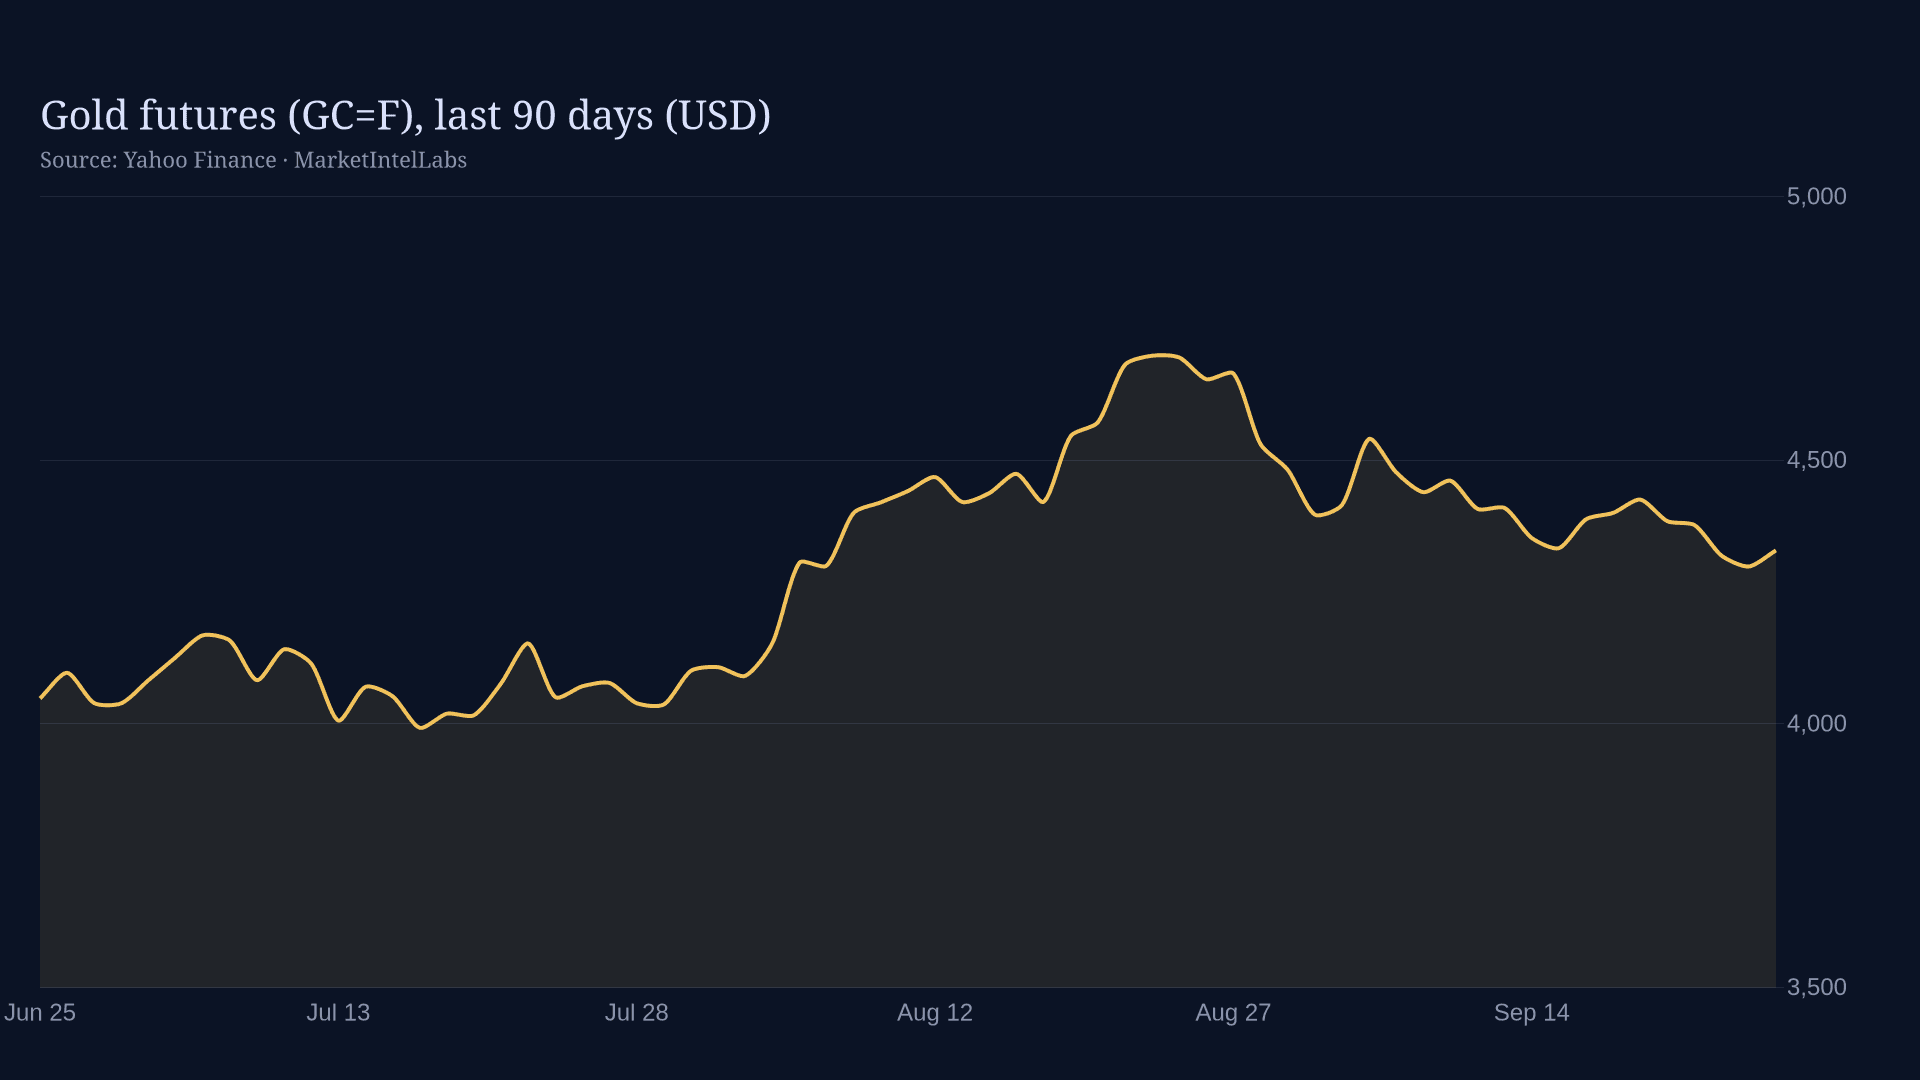
Gold holds $4,408/oz as central-bank buying offsets crowded futures positioning, while a Grasberg-linked smelter outage pushes copper toward a 2026 deficit.

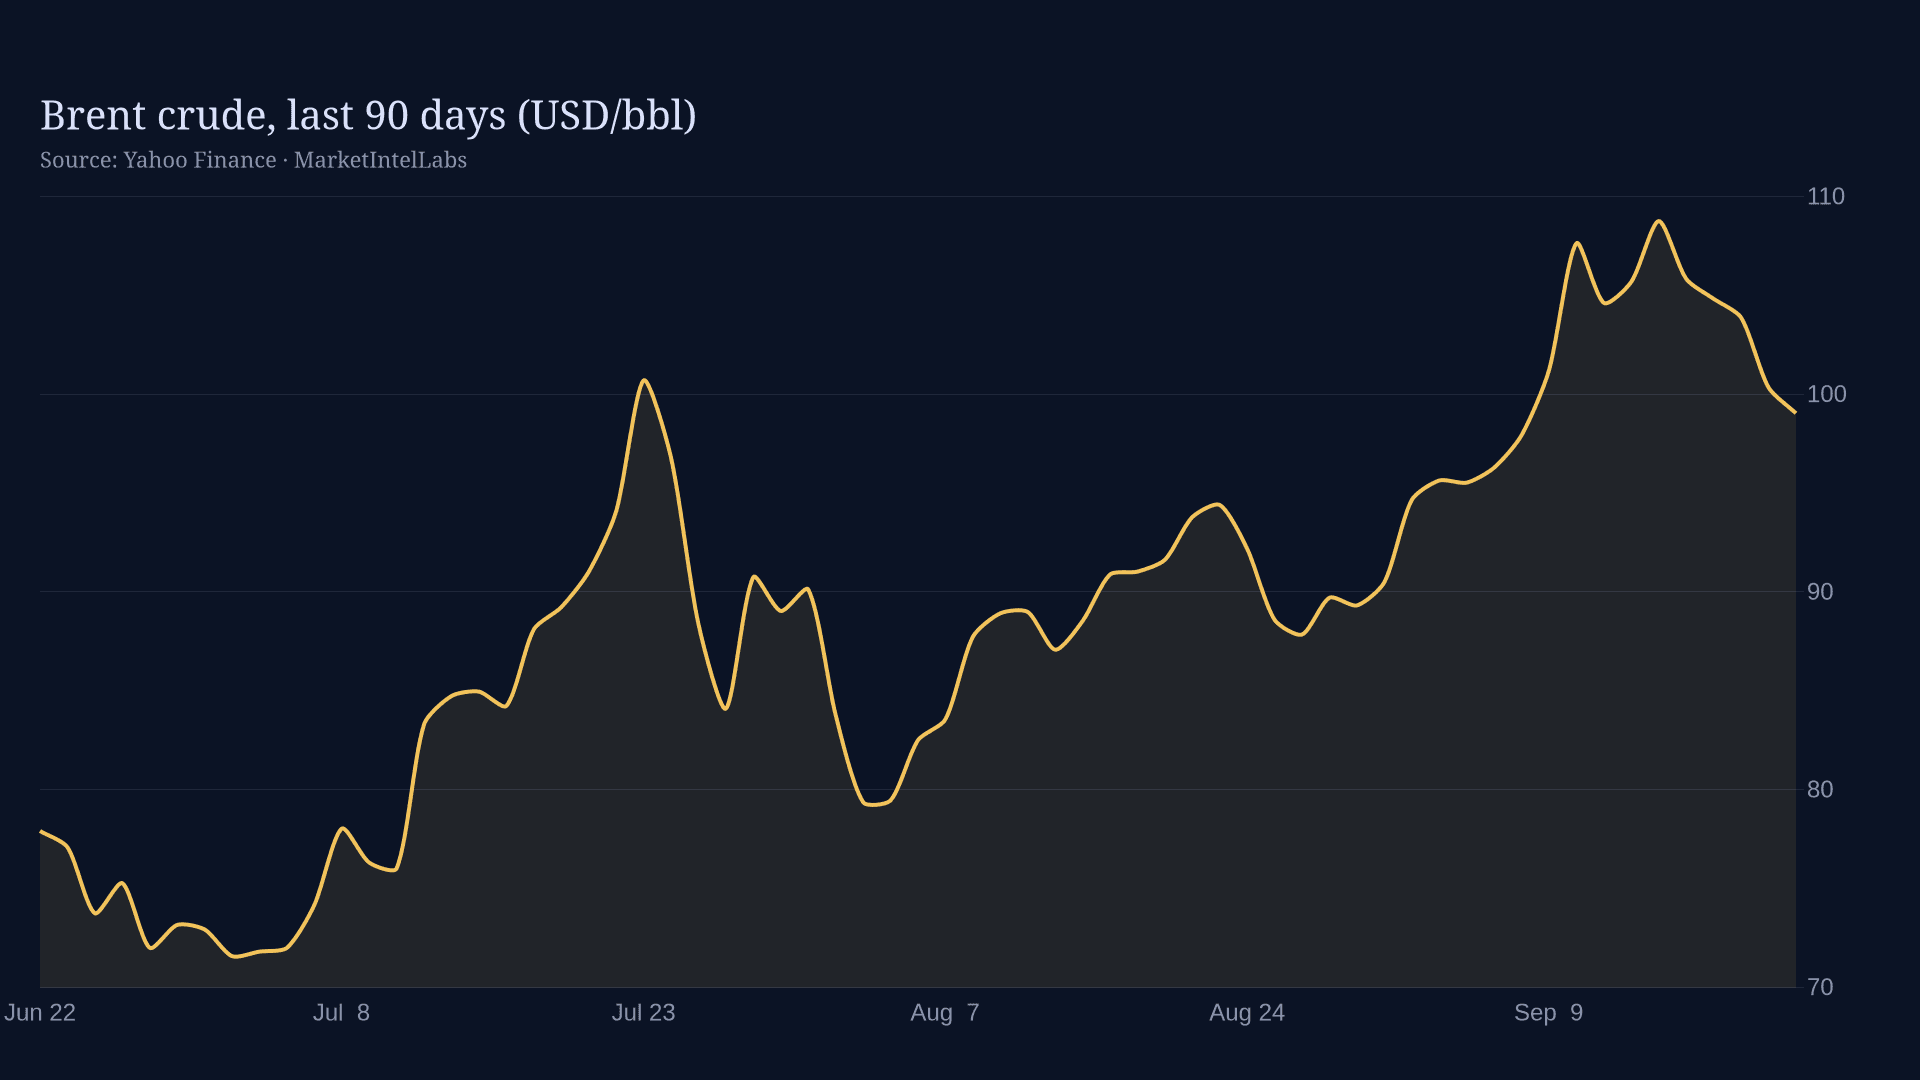
Gold holds $4,408/oz as COMEX Managed Money net longs jump to 130,766 contracts, Brent slips to $88.37 on a Hormuz standoff, and copper sits near record highs after a Grasberg-linked smelter outage.

The Fed held rates at 3.50%-3.75% on a 9-3 vote, with three hawkish dissents. Core PCE and CPI remain well above target as gold and silver hit records.

GLD holds near $400.96 and SLV near $58.55 after a sharp two-week breakout, with record central bank buying providing the floor ahead of Wednesday's CPI print.

GLD is up 7.2% and SLV 11.6% off early-August lows as record central bank gold buying meets a dovish Fed repricing, with Wednesday's CPI print the next swing factor for a crowded managed-money long book.

July CPI consensus expects 0.1% m/m and 3.4% y/y headline, 0.2% core, versus June's 0.4% drop. Here is how rates, the dollar, and gold would react.

Gold spot hit a fresh record near $4,417/oz Tuesday, up 10.38% over the trailing month, but the last CFTC positioning read is a week stale. Here is what that gap means going into Wednesday's CPI print, plus the copper and oil setups riding alongside it.

July payrolls fell 23,000 and September Fed hike odds collapsed toward zero. The dollar hit a 7-week low as gold pushed near record highs.

Gold is holding the $4,300 breakout Monday morning after last week's 7% rally, with GLD, SLV and the miners all firm. Copper sits near record levels on a real supply deficit, and oil stays two-sided as Hormuz tension meets a surprise inventory build.

Gold is holding $4,300 after a 7%+ weekly rally sparked by a weak jobs report, and CFTC data shows positioning isn't crowded yet. GDX and GDXJ ripped 7% as miners closed a wide gap to spot. Copper and oil carry their own tariff and Hormuz risk premiums into Wednesday's CPI print.

July CPI Wednesday is this week's only cross-sector catalyst: no FOMC, no Fed speeches. Levels to watch in stocks, gold, silver, oil, and crypto.

Russia's crypto settlement law goes live September 1 in the same six week window as the EU's toughest sanctions package yet, OFAC dismantled Iran's Hormuz insurance racket, and central banks bought gold at a 62% faster pace. Three separate headlines, one architecture.

Gold reclaimed $4,334/oz on Friday, August 7, its fourth consecutive session of gains, as Iran-Oman-US talks on the Strait of Hormuz pulled September Fed rate-hike odds from 67% to 55%. Key support at $4,264; resistance at $4,355-$4,400.

Spot gold at $4,257.88 holds above $4,200 despite a rising dollar as the Strait of Hormuz crisis keeps a geopolitical risk premium across commodities. WTI crude stabilizes in the $78-$84 range after a $126/bbl peak. Key levels and both sides of the trade.

Friday's July Employment Situation report is the most consequential labor market data point before the Fed's September 16-17 decision. Consensus expects +88K payrolls and 4.2% unemployment. Here's the reaction function across rates, gold, equities, and crypto.

Saudi Arabia leads OPEC+'s fourth consecutive 188,000 bpd output hike, pressuring WTI toward $70. Gold at $4,327 holds central bank demand floor despite ESG mining fines.

Silver surged 2.6% to $59/oz on August 5 as copper hit a 52-week high and oil fell 5% on ceasefire news. Gold holds $4,161 with a CFTC positioning washout as backdrop.

Chinese institutional investors have put a floor under gold at $4,000, with 14 straight days of ETF inflows and the People's Bank of China adding 15 tonnes in June. Here's what the data actually shows.

Spot gold held $4,064 on August 4 as the World Gold Council's 2026 survey found 45% of central bank reserve managers plan to add gold over the next 12 months, the most bullish reading in nine years. Silver futures up 59% on the year. WTI crude posted an 18% July gain.

Deutsche Bank analyst Michael Hsueh's model puts gold fair value at $4,700/oz, 16% above August 4 spot of $4,063. The bank's BSADF statistical test still reads above its critical threshold, confirming the rare explosive price phase persists.

Gold has lost 27% from its February 2026 war peak of $5,461/oz as the dollar strengthens under a hawkish new Fed Chair. WTI crude's 16.85% Hormuz rally is fading. Copper sits 1.7% below a 52-week high, supported by AI infrastructure demand and mine-supply deficits. Here is what the positioning data tells us about where all three go next.