Week Ahead: FOMC Decision, Retail Sales Take Center Stage
FOMC decision and August retail sales land Wednesday: what the dot plot, the 10-year yield, and key support levels mean for the week of September 14-18.
Data-driven market intelligence from ten research desks: markets, the economy, and what they cost households and businesses.

FOMC decision and August retail sales land Wednesday: what the dot plot, the 10-year yield, and key support levels mean for the week of September 14-18.

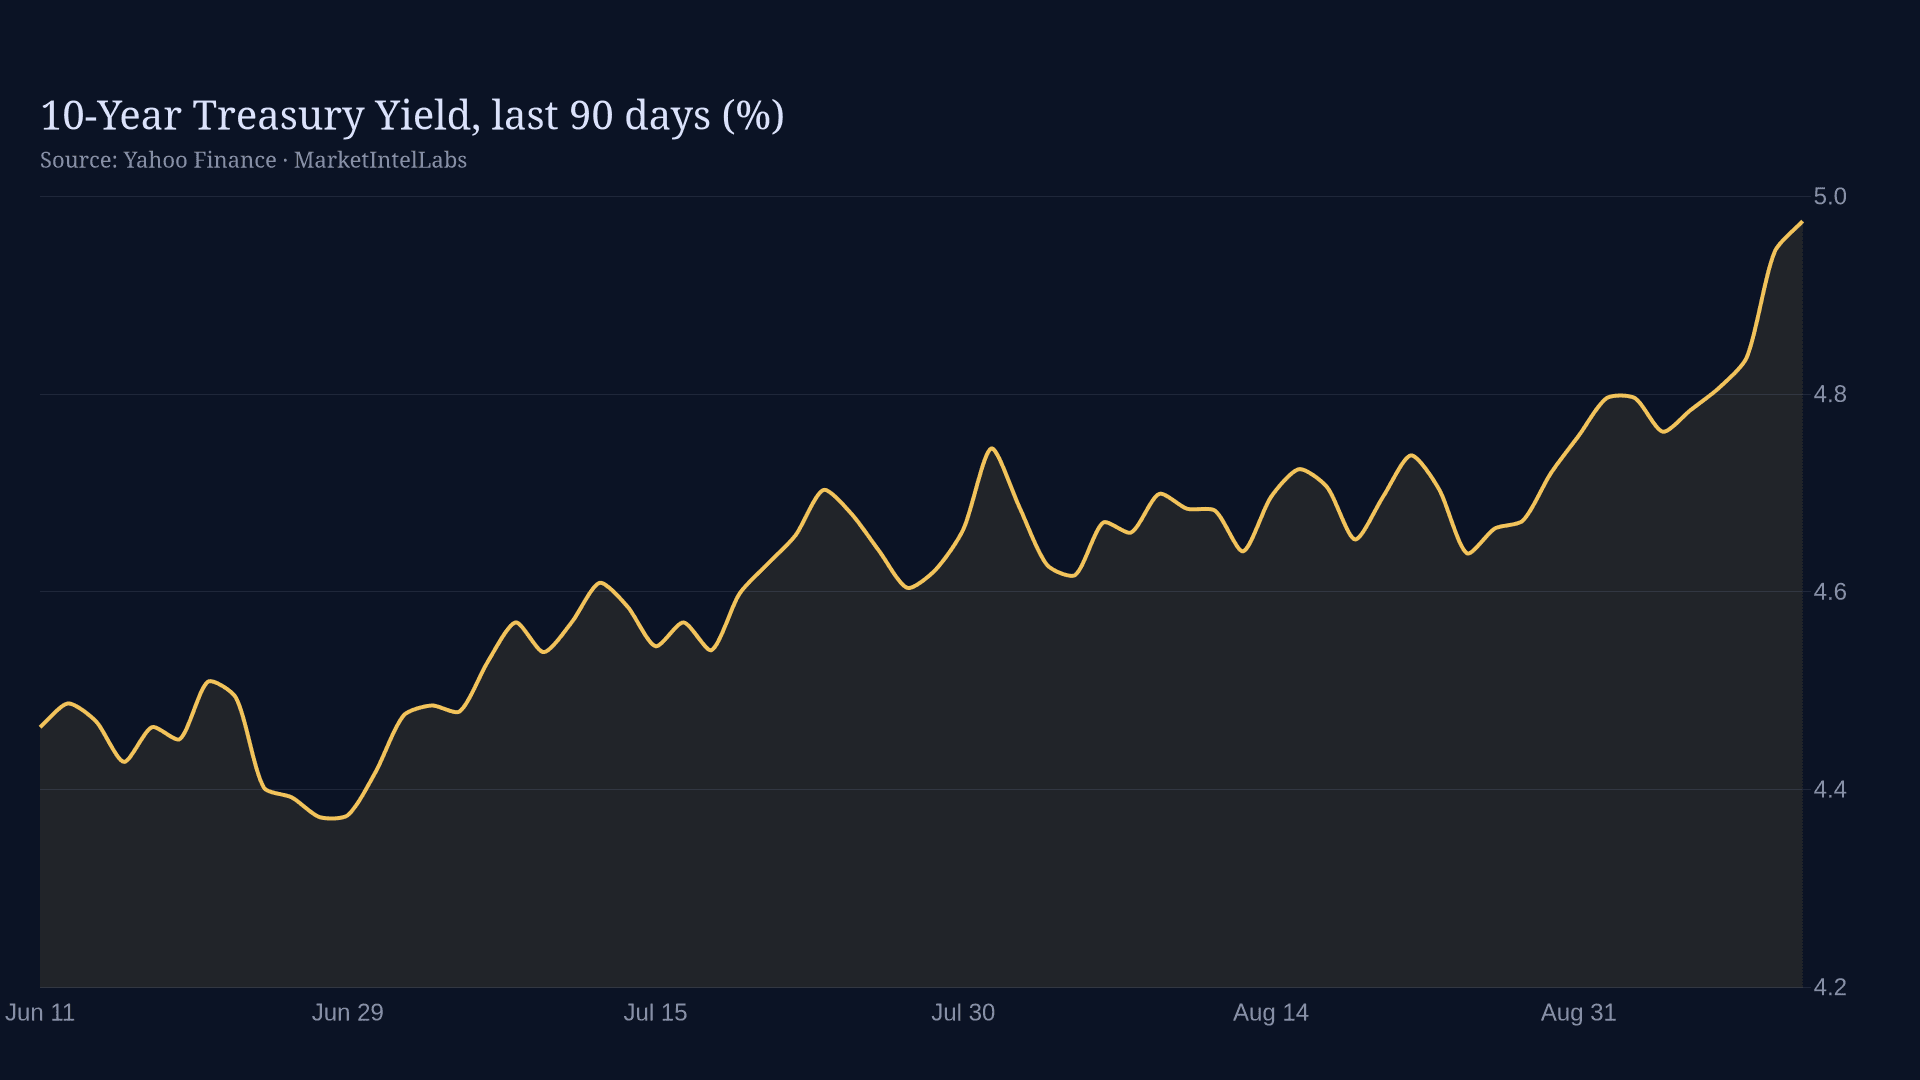
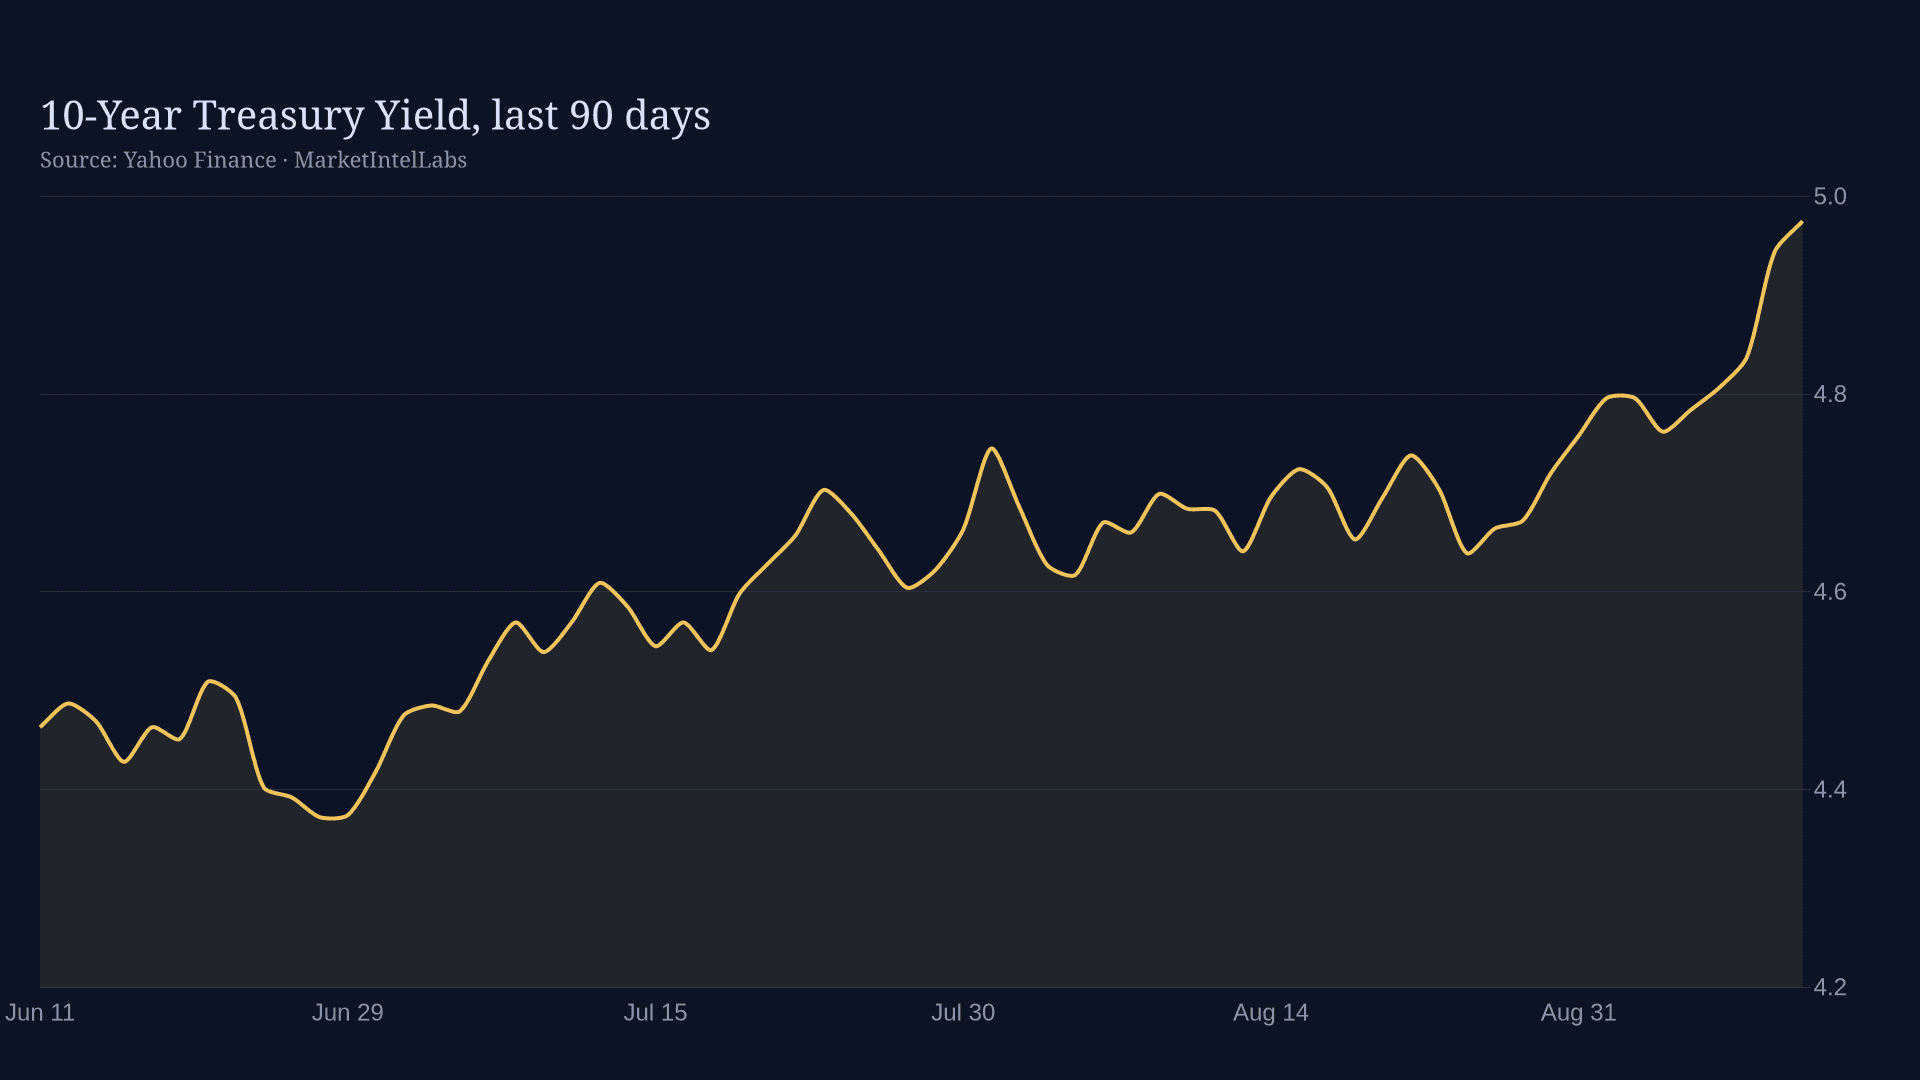
The 10-year Treasury threw off its flat mid-week calm and repriced every risk asset this week. Here is how the term premium came back, what the 4.8 to 4.95 percent move means for the Fed path, and where the rotation lands next.

OFAC's September 10 notice pairs a shift to presumption of denial for Iran specific licenses with new terrorism-financing designations and a $1.43 million enforcement settlement. Together the three actions mark a policy-lever change in how the sanctions machinery processes exceptions, not just another name on the SDN list.

# CPI Reaction: August Inflation Print Surprises Markets The August CPI print arrived hotter than expected on the headline, complicating the Federal Reserve's path forward as it approaches next week's...

The 10-year Treasury yield surged 11 basis points to 4.94% on Thursday, its highest level in two weeks, as traders brace for tomorrow's August CPI print. The move pressured risk assets across the

Tomorrow's August CPI print will set the tone for markets heading into the September FOMC meeting. With the 10-year Treasury yield climbing to 4.94% and the VIX spiking 8.4% to 17.84, investors are positioned for elevated volatility. Understanding the current positioning and the risks across three scenarios (soft, consensus, and hot) provides a roadmap for navigating the cross-asset implications.

Gold declined 1.73% to $396.36 but remains above its 200-day moving average at $390. The August CPI print will be the key catalyst for gold and commodities this week.

Friday's market selloff marked a clear rotation from growth to defensives as Treasury yields surged. Here's what it means for your portfolio and which sectors to watch.

The 10-year Treasury yield surged to 4.94%, pushing equities lower as the VIX fell. With CPI data due tomorrow, markets are bracing for what the print means for Fed policy.

VIX surges 8.4% as defensive positioning takes hold, here's what the volatility spike signals about market sentiment

Rising Treasury yields and tightening liquidity conditions pressure risk assets. Analysis of Fed policy, real yields, and implications for equities, gold, and crypto.

With the September FOMC decision days away and CPI data pending, positioning data reveals how traders are positioned across assets. Here is what the numbers tell us.