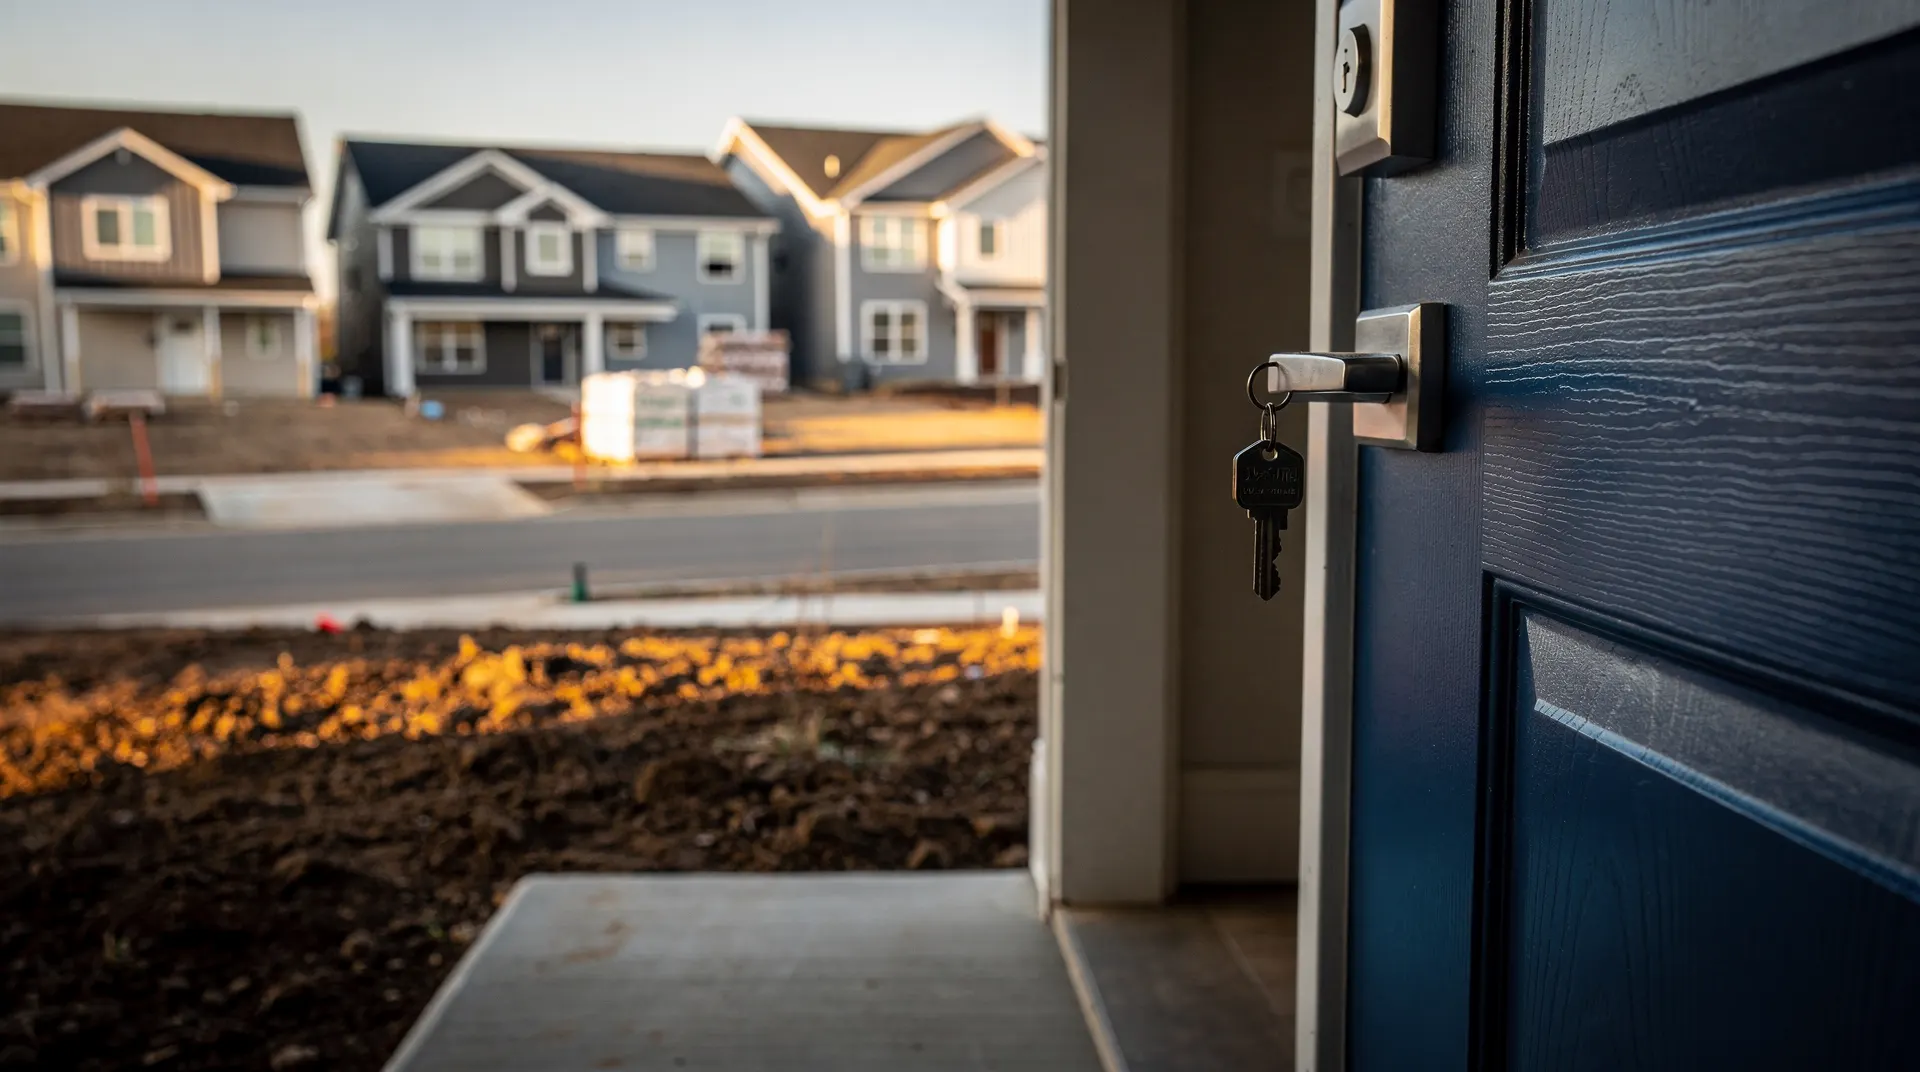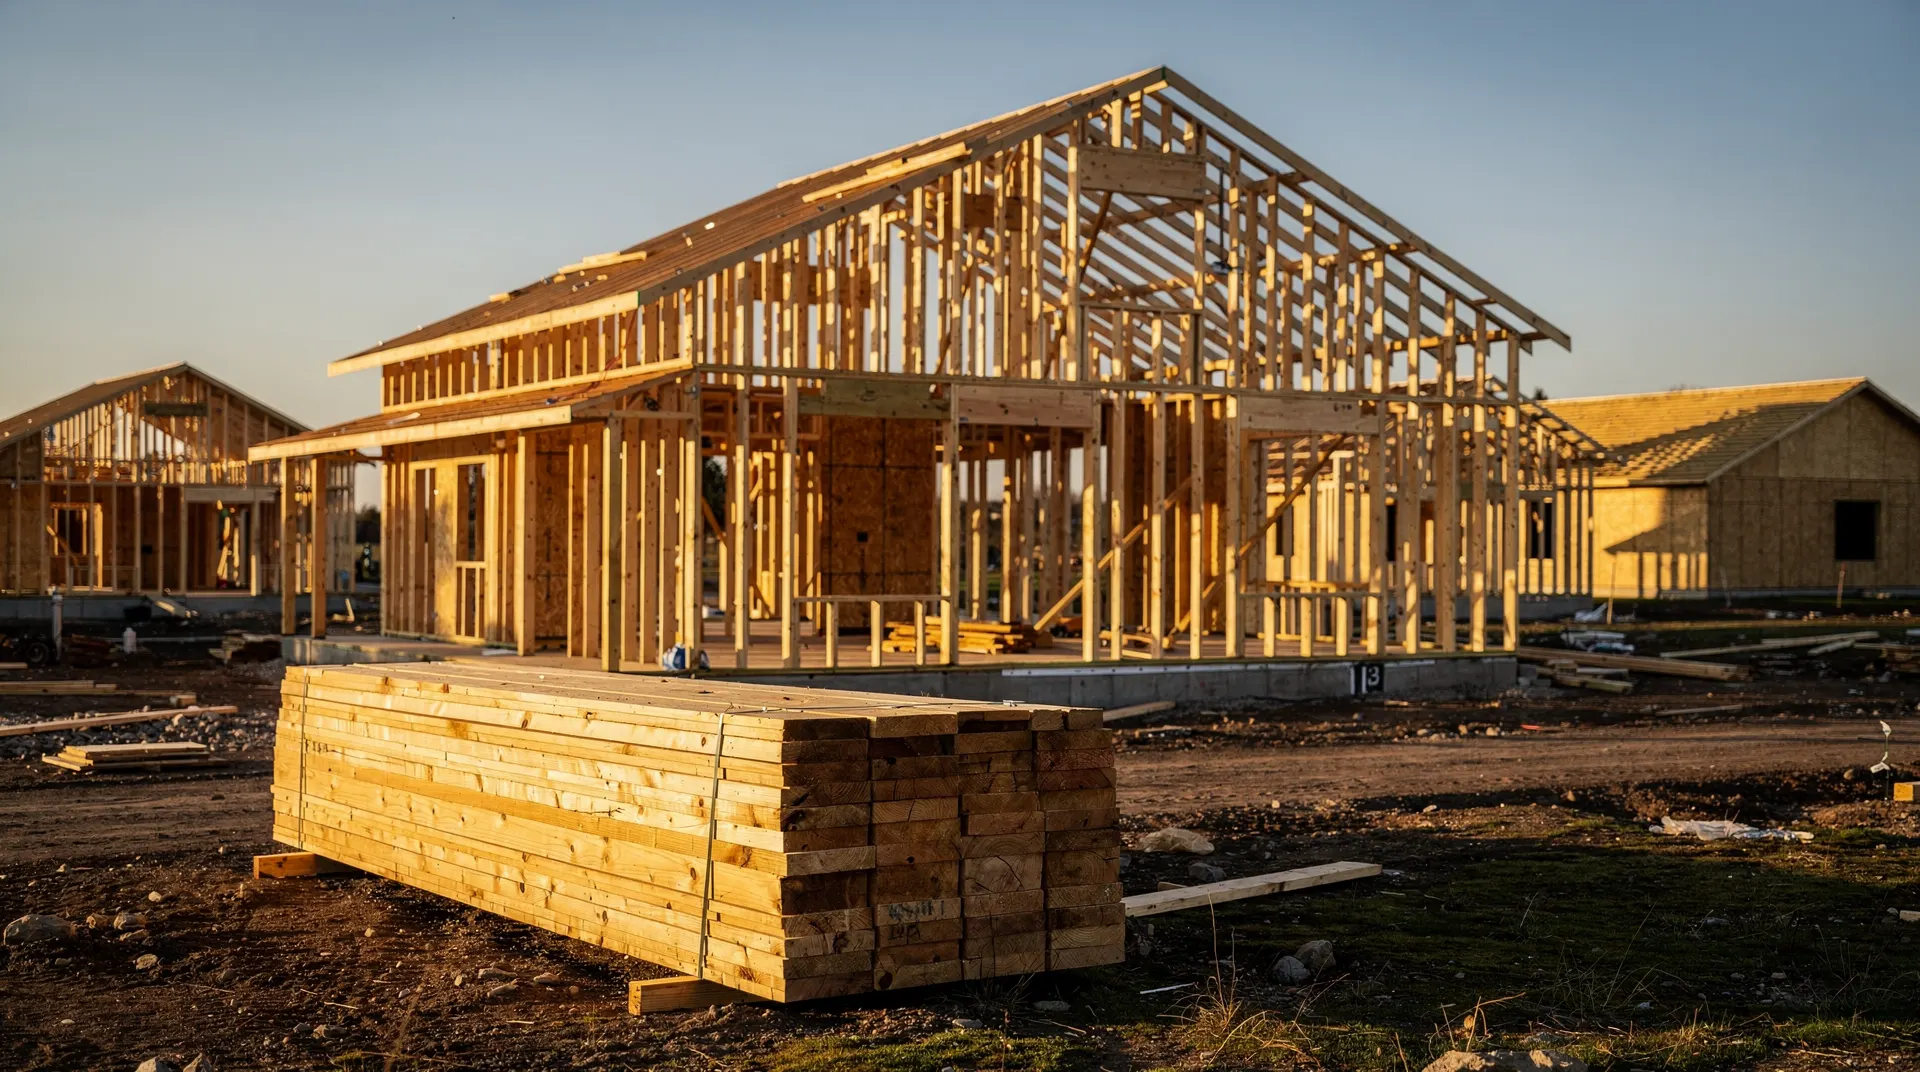
Housing Starts

1.22M

−67,000 (−5.2%) vs Aug

As of Sep 2026 · Updated monthly · Source: Census Bureau and HUD New Residential Construction, seasonally adjusted annual rate, via FRED

Housing StartsSep 1, 2021 to Sep 1, 2026
1.14M1.32M1.49M1.67M1.84MSep 1, 2021May 1, 2023Jan 1, 2025Sep 1, 2026

Previous

1.29M

Aug 2026

One year ago

1.32M

−98,000 (−7.4%) since

52-week high

1.52M

Mar 2026

52-week low

1.18M

May 2026

Recent readings

DateHousing startsChange
Sep 20261.22M−67,000 (−5.2%)
Aug 20261.29M−81,000 (−5.9%)
Jul 20261.37M−70,000 (−4.9%)
Jun 20261.44M+257,000 (+21.7%)
May 20261.18M−232,000 (−16.4%)
Apr 20261.41M−108,000 (−7.1%)
Mar 20261.52M+176,000 (+13.1%)
Feb 20261.35M−39,000 (−2.8%)
Jan 20261.39M+7,000 (+0.5%)
Dec 20251.38M+59,000 (+4.5%)
Nov 20251.32M+46,000 (+3.6%)
Oct 20251.27M−46,000 (−3.5%)

Most recent first; change is versus the prior reading shown. Source: Census Bureau and HUD New Residential Construction, seasonally adjusted annual rate, via FRED.

Related series

Building permits
1.40MSep

What this number is

The annual rate at which construction began on new homes in the latest month, seasonally adjusted, from the Census Bureau and HUD New Residential Construction report. Building permits, the leading indicator for starts, is shown beside it.

Why it matters

Housing is the most interest-rate-sensitive part of the economy, and starts are the first place a change in mortgage rates shows up in real activity. A rate near 1.5 million a year is healthy; below 1.2 million has coincided with recessions.

Questions readers ask

Why look at permits?
A permit comes before a start by one to two months and is less affected by weather, so permits give the cleaner read on where starts are heading.
When is the next housing starts report?
Around the 17th to 19th of each month at 8:30 AM Eastern, for the prior month.

Latest from the Housing desk

All coverage →