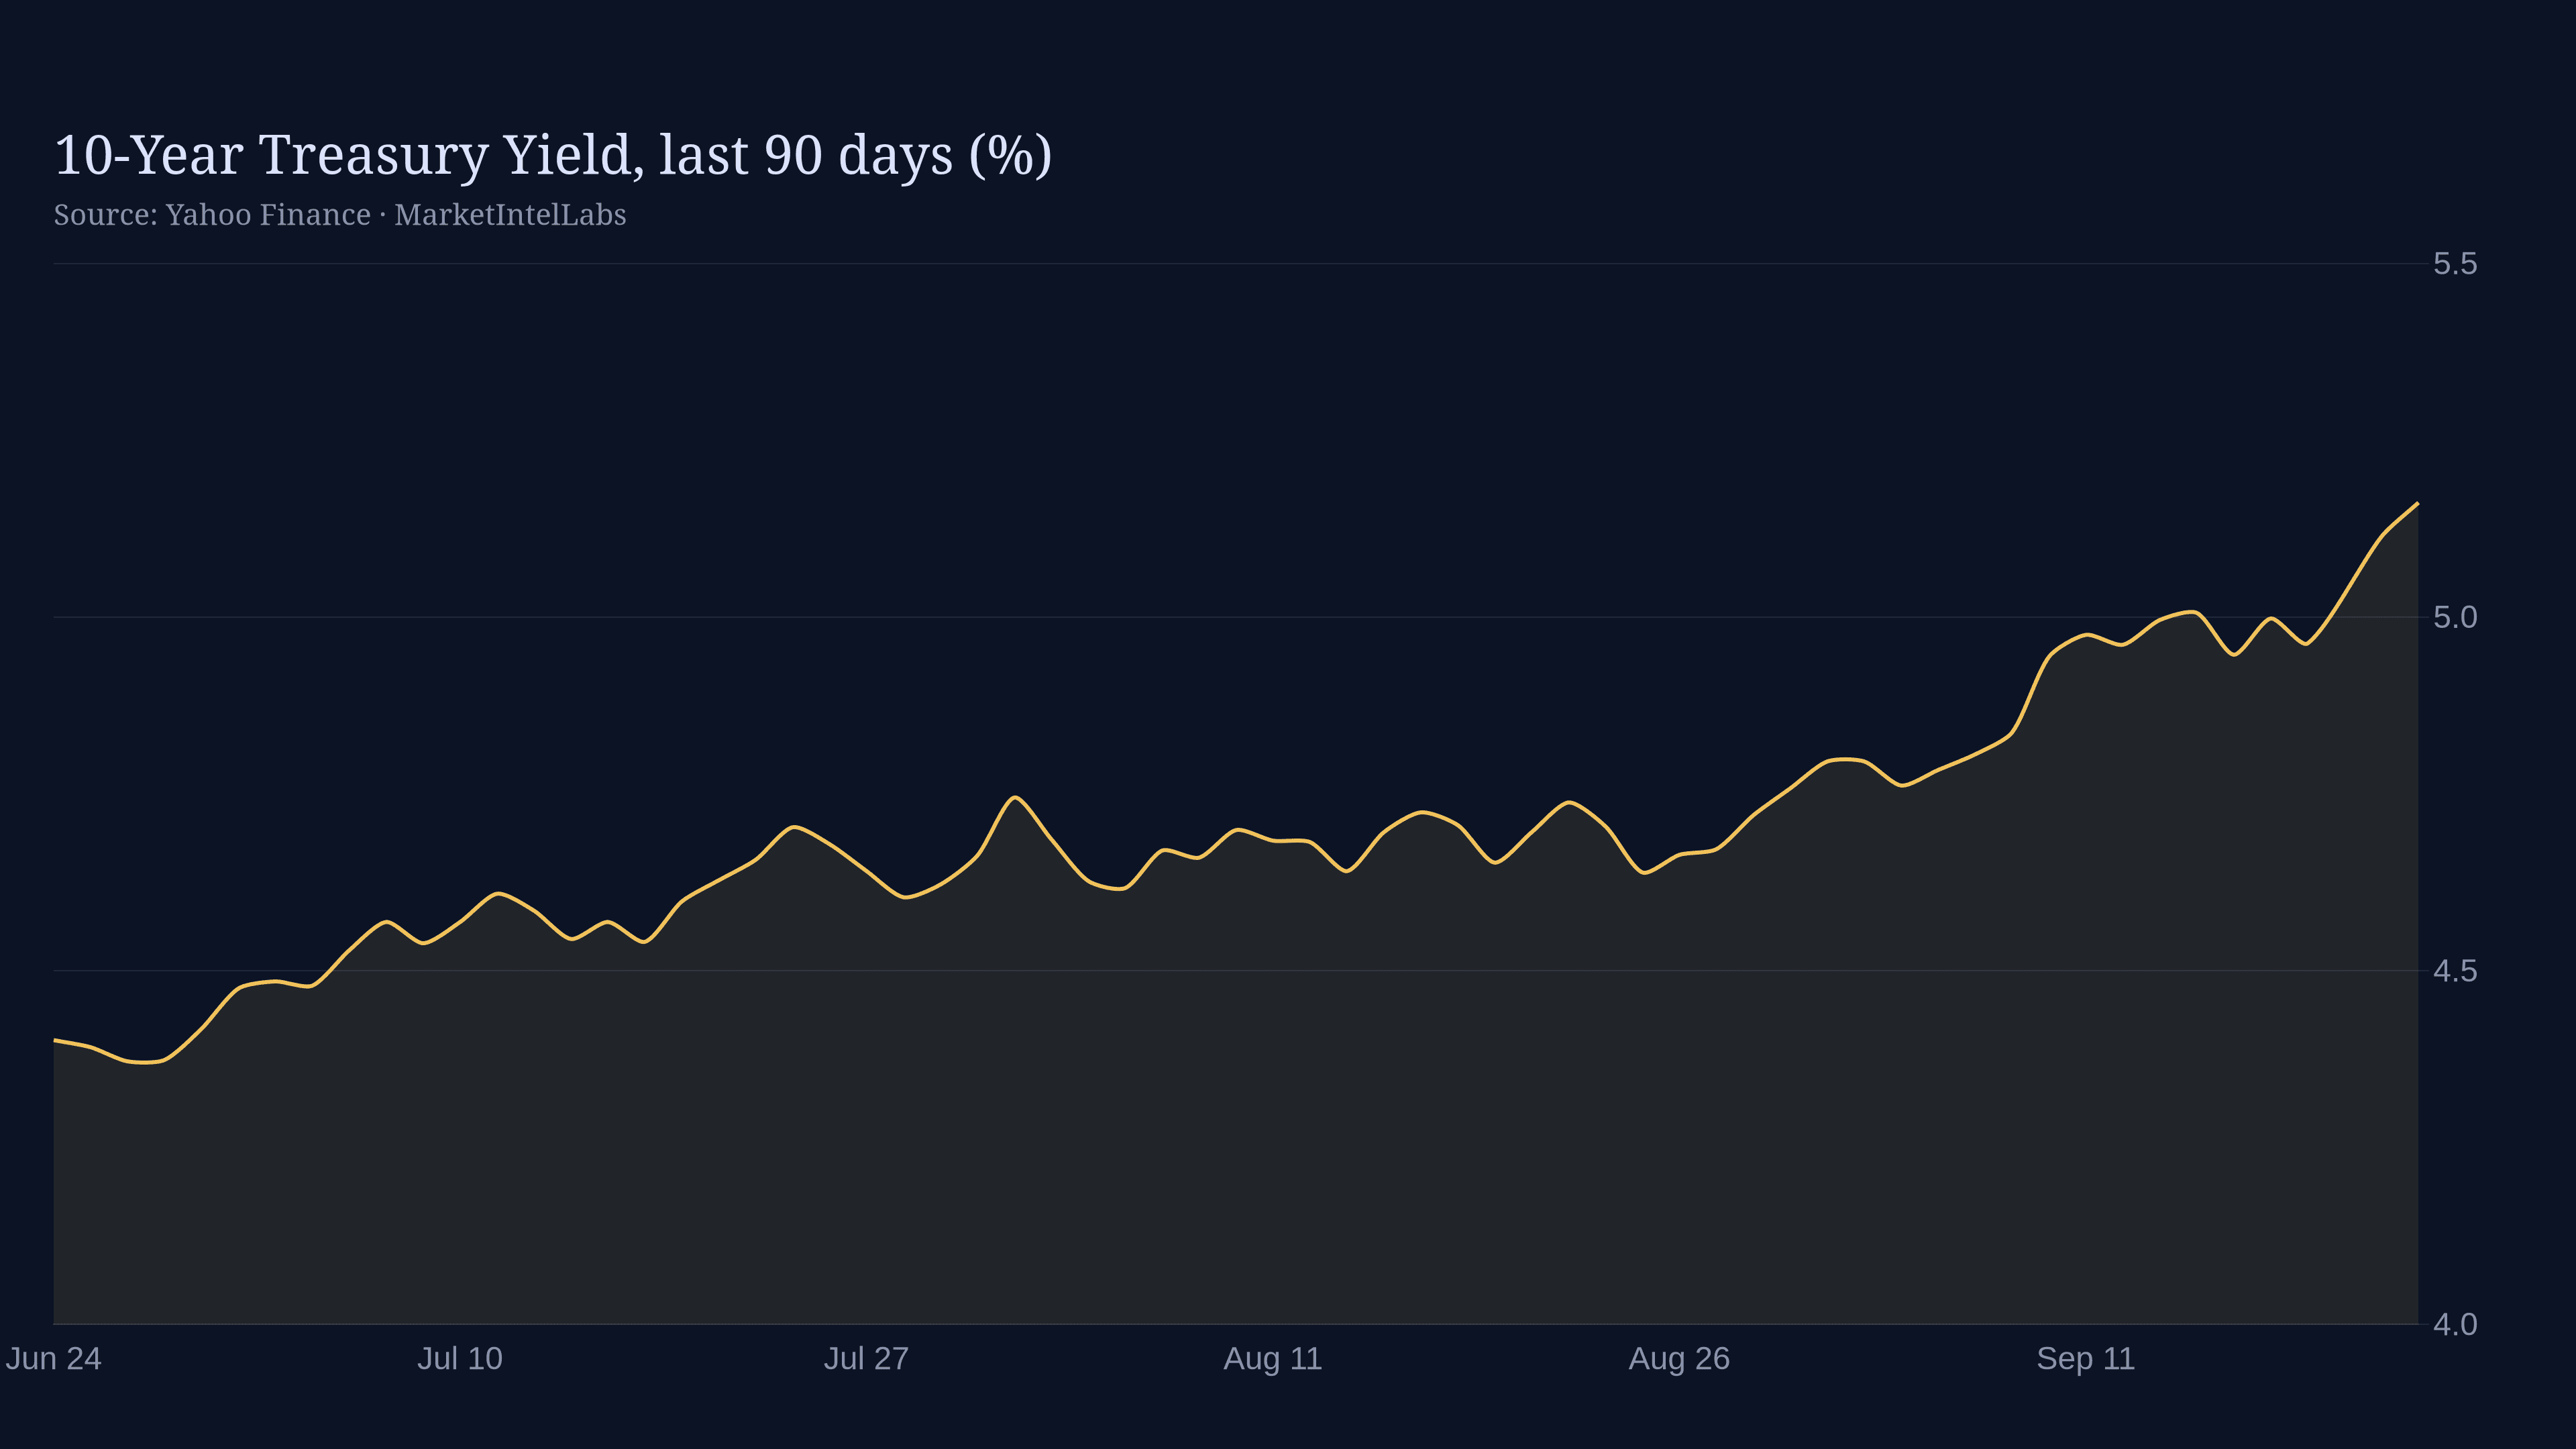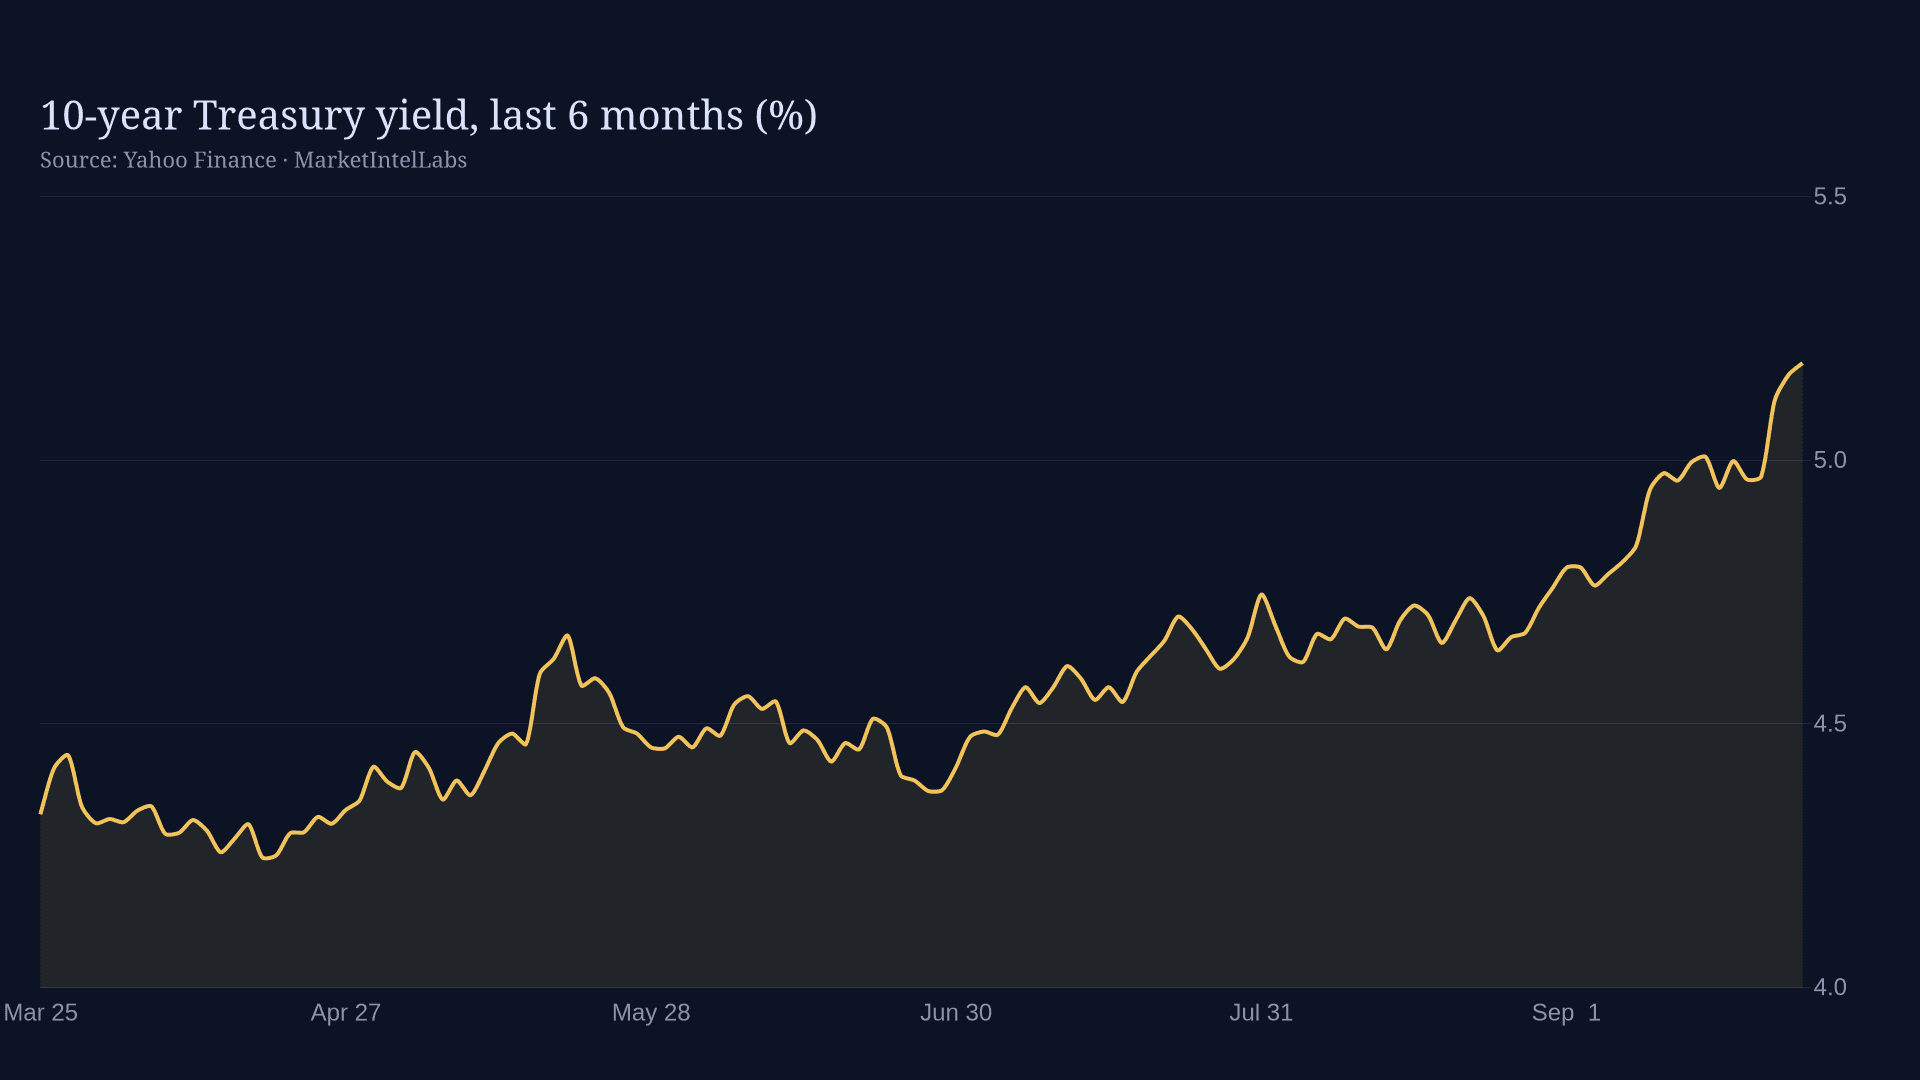
10-Year Treasury Yield

5.18%

+7 bp vs Sep 23

As of Sep 24, 2026 · Updated each business day · Source: U.S. Treasury constant-maturity yield, via FRED

10-Year Treasury YieldSep 27, 2021 – Sep 24, 2026
1.21%2.26%3.30%4.35%5.40%Sep 27, 2021May 25, 2023Jan 24, 2025Sep 24, 2026

Previous

5.11%

Sep 23, 2026

One year ago

4.16%

+1.02 pp since

52-week high

5.18%

Sep 24, 2026

52-week low

3.97%

Oct 22, 2025

Related series

2-year
4.87%Sep 24
30-year
5.47%Sep 24

What this number is

The yield on the U.S. Treasury's 10-year note, at constant maturity, as published by the Treasury each business day. It is the benchmark that mortgage rates, corporate borrowing costs and equity valuations are priced against.

Why it matters

The 10-year is the market's verdict on growth and inflation over the next decade. When it rises faster than the Fed's policy rate, the market is saying the Fed is behind; when it falls below the 2-year, the curve is inverted and recession odds are being priced.

Questions readers ask

What moves the 10-year yield?
Inflation expectations, expected Fed policy, Treasury supply, and demand from foreign buyers and pension funds. On data days (CPI, jobs) it can move 10–20 basis points in minutes.
What is the 2s10s spread?
The 10-year yield minus the 2-year yield. A negative spread (inversion) has preceded every U.S. recession since the 1970s, usually by 12–18 months.

Latest from the Macro desk

All coverage →