S&P 500 Index

7,743.41

+39.28 (+0.51%) vs Sep 24

As of Sep 25, 2026 · Updated each business day · Source: S&P Dow Jones Indices daily close, via FRED

S&P 500 IndexSep 28, 2021 – Sep 25, 2026
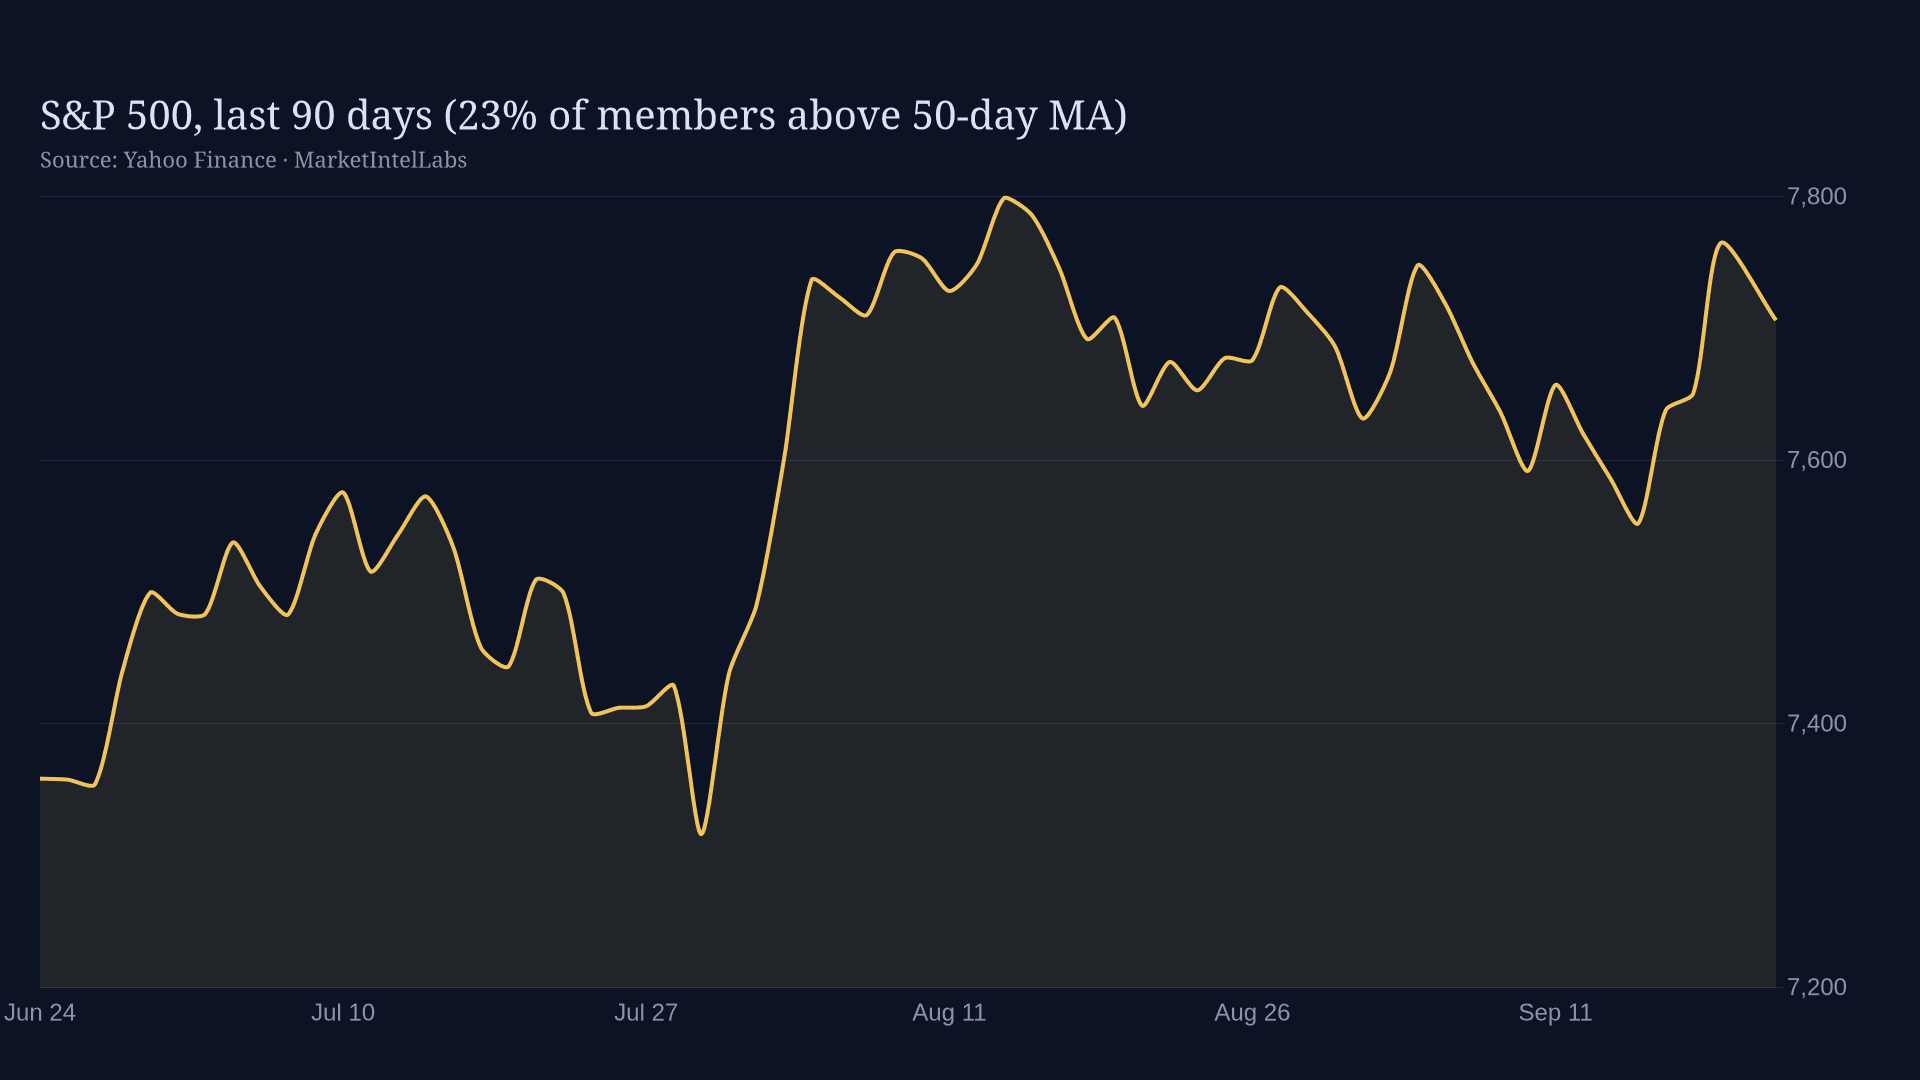
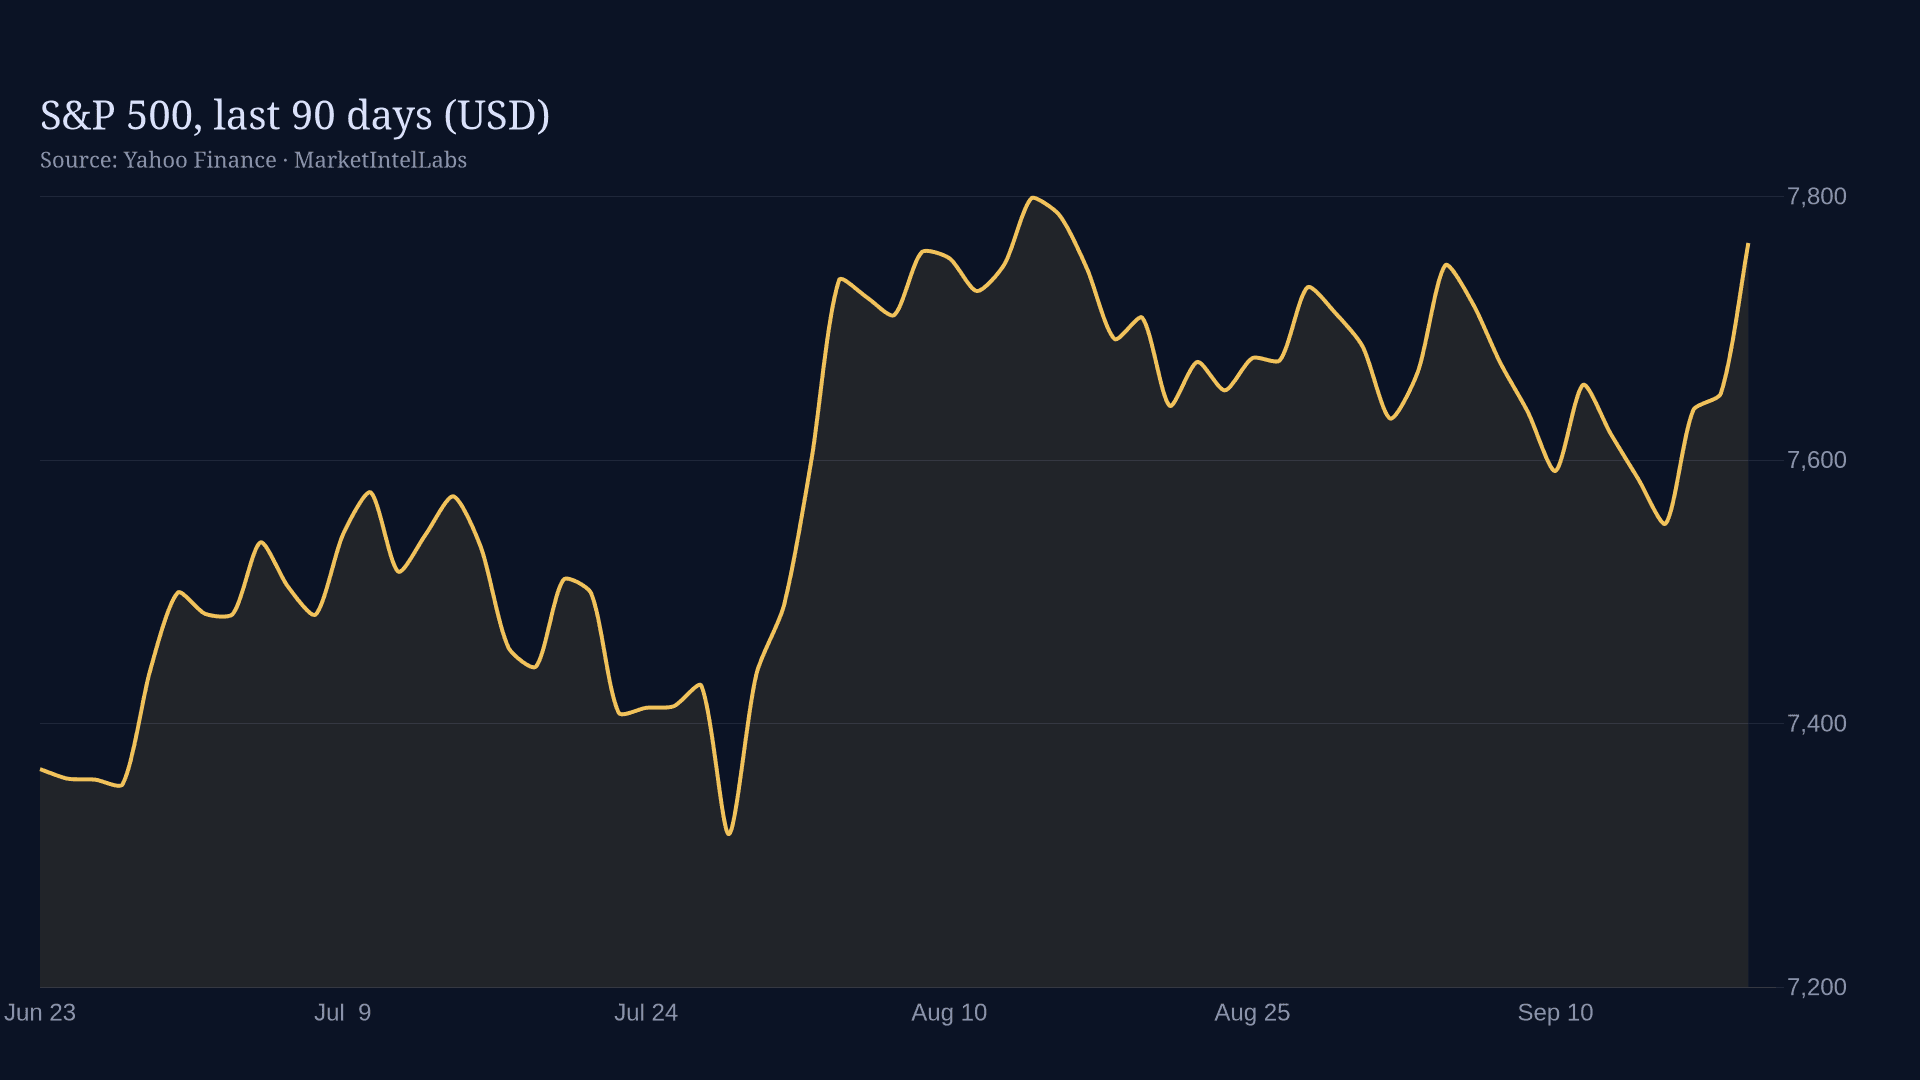
3,3364,5155,6946,8738,052Sep 28, 2021May 25, 2023Jan 24, 2025Sep 25, 2026

Previous

7,704.13

Sep 24, 2026

One year ago

6,604.72

+1,138.69 (+17.24%) since

52-week high

7,798.99

Aug 13, 2026

52-week low

6,343.72

Mar 30, 2026

What this number is

The daily closing level of the S&P 500, the capitalization-weighted index of roughly 500 large U.S. companies that most index funds and retirement accounts track.

Why it matters

It is the scoreboard for U.S. equities and the base of most retirement wealth. Because the largest ten stocks are around a third of the index, its direction increasingly reflects a handful of technology companies.

Questions readers ask

Why does the S&P 500 fall on good economic news?
Strong data can mean fewer Fed cuts and higher yields, which lower the present value of future earnings. Markets trade the second-order effect on rates, not just the headline.
How far back does this chart go?
FRED carries ten years of S&P 500 history under license; the chart shows what is available.

Latest from the Equities desk

All coverage →
S&P 500 today: 7,743.41 (Sep 25, 2026) | MarketIntelLabs