Current Fed Funds Rate Explained: 3.75% to 4.00%


The current fed funds rate is a target range of 3.75% to 4.00%, not a single promised rate on a savings account or a mortgage. The Federal Open Market Committee held that range on October 28 after raising it in September. The latest effective rate shown by the New York Fed when checked for this feature was 3.88% for November 4 transactions. That is the observed overnight market rate, distinct from the Fed's policy target. Friday's October employment report was still scheduled for release after this article was prepared; no October payroll figure is assumed here. The pre-release jobs report guide sets out what that document could test.
Those four numbers answer different questions. The range is what policymakers instruct the New York Fed's trading desk to maintain. The effective rate summarizes trades that actually occurred. The reserve and reverse repo rates are operating settings intended to help keep those trades in the desired corridor. Conflating them can make a policy hold look like an unannounced rate change. The recent Fed rate-odds analysis covers the market's December expectations; this feature explains the plumbing and the readings to watch between decisions.
Related reading: FOMC Decision Today Explained: October Vote Due at 2 PM ET.
How the current range got here
The Fed's September 16 policy statement raised the target range by a quarter percentage point to 3.75% to 4.00%. Its language tied the action to an inflation rate that remained elevated and to its dual mandate. That is a change in an overnight policy range, not a direct order to every lender to increase loan coupons by one quarter point. New contracts and floating rates respond through funding markets, risk premiums and expectations, sometimes before the actual policy decision.
On October 28, the FOMC statement maintained 3.75% to 4.00% by a 10 to 2 vote. Lisa Cook and Beth Hammack preferred a quarter-point increase. The statement described strong economic activity, resilient domestic spending and still-elevated inflation. It also said more information would help determine the stance appropriate for a timely return to the 2% inflation objective. The disagreement matters because a hold was not a declaration that the next decision was settled.
For the broader framework, see our Fed policy coverage.
What the rate actually measures
The federal funds market is an overnight market in unsecured dollars. As the Federal Reserve Bank of New York's rate page explains, depository institutions borrow from other depository institutions and certain other entities, particularly government-sponsored enterprises. Its effective federal funds rate is the volume-weighted median of transactions reported in the FR 2420 selected money market rates report. Median means the rate at the middle of the volume distribution, not the simple average of every quoted trade.
The distinction between a target and an observation is practical. A target range of 3.75% to 4.00% gives a corridor for the overnight transaction market. A 3.88% effective rate inside that range indicates the benchmark transaction measure was inside the corridor on the stated date. It does not mean every transaction cleared at 3.88%. On the New York Fed page consulted for this feature, the November 4 row showed 3.88%, with $115 billion of reported volume and a 3.75% to 4.00% target range. The page publishes the previous business day's measure at approximately 9 a.m.; the observation date is what must accompany any quotation.
The October 28 implementation note provides the mechanical bridge between the committee's range and trading. It kept interest on reserve balances at 3.90% effective October 29, directed the Desk to conduct standing overnight repurchase operations at 4.00%, and set the standing overnight reverse repurchase offering rate at 3.75%, subject to a per-counterparty daily limit. It also described Treasury bill purchases, when appropriate, to maintain ample reserves. None of those settings is a new retail deposit-rate mandate.
Why pay interest on reserves? A bank eligible to earn 3.90% on balances at the Fed generally has less reason to lend overnight at a markedly inferior rate, allowing for differences in eligibility, balance-sheet costs and transaction conditions. The Fed's reserve-balance policy page says the Board determines the interest rate and calls it an important monetary-policy tool. The New York Fed's market includes entities that cannot simply earn interest on reserves in the same way banks can. That is one reason the observed effective rate need not equal 3.90% exactly.
The reverse repo offering rate helps provide another outlet for eligible counterparties' cash and can support the lower side of the operating framework. The standing repo facility provides a collateralized route to liquidity near the upper side under its rules. These are different instruments from unsecured federal funds loans, and their quoted rates are not interchangeable benchmarks. The position of the actual transaction measure within the range is a check on implementation, not a separate FOMC vote.
There is useful history in the chart below. The monthly Federal Reserve target upper-bound series, retrieved through the St. Louis Fed's FRED service, shows 4.00% at the end of October and November 2025, 3.75% from December 2025 through August 2026, and 4.00% again in September and October 2026. These are end-of-month upper bounds, not monthly averages and not the effective transaction rate. A reader comparing a daily market quote with this stair-step series needs to keep that difference in mind.
The source table for the chart reads: October 2025, 4.00%; November 2025, 4.00%; December 2025 through August 2026, 3.75% in each month; September and October 2026, 4.00% in each month. The plotted observations exclude a missing November 2026 placeholder rather than drawing a future point. The series locator is Federal Reserve target upper bound, DFEDTARU; the chart is our own rendering of the retrieved monthly observations.
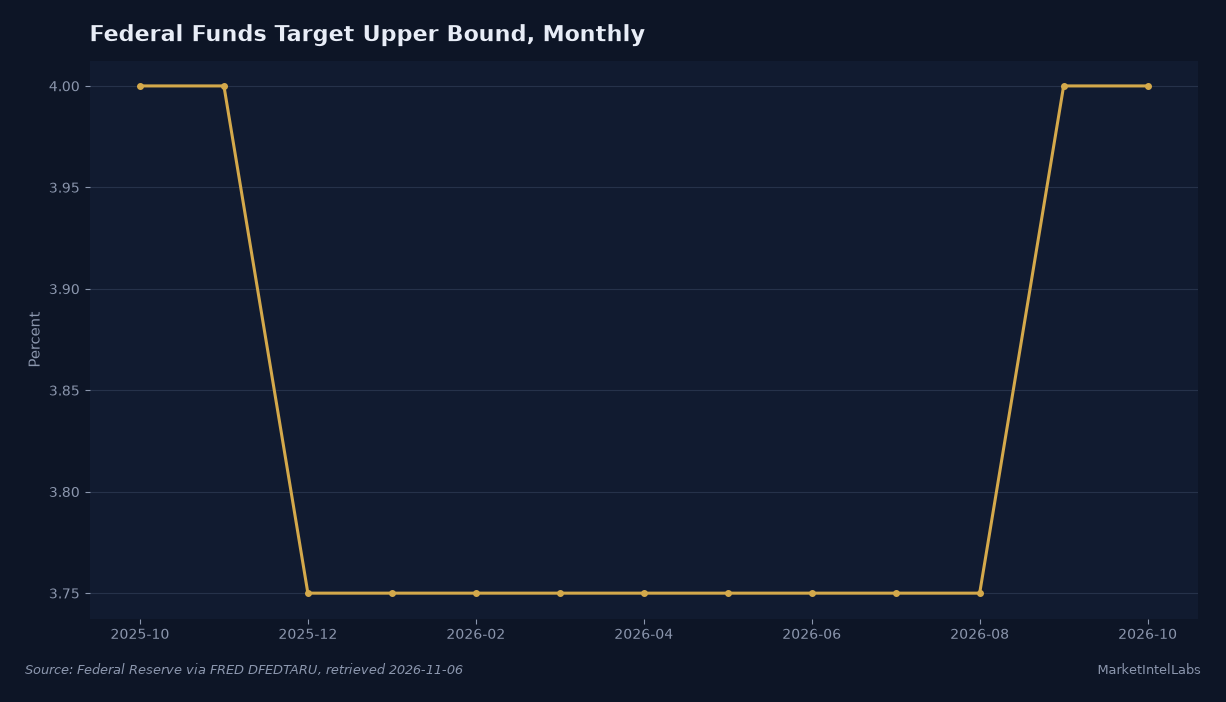
A staircase is the right shape for the policy series: the committee decides at meetings rather than repricing the target continuously. The long flat section in the chart says nothing by itself about whether borrowing conditions stayed constant. Treasury yields, loan spreads and equity discount rates can move every day as investors revise their view of future policy and inflation. The chart establishes what the committee has done, not what it will do in December.
The word "rate" also obscures timing. A Fed policy announcement can reprice two-year Treasury yields in minutes because those securities incorporate the expected sequence of overnight rates over many months. A ten-year yield also reflects term premiums and inflation expectations; it does not mechanically move one for one with today's funds range. A household mortgage quote includes lender costs, credit risk, duration and the secondary mortgage market. Looking only at the current overnight target to forecast next week's mortgage offer skips most of that transmission chain.
Likewise, a savings-account annual percentage yield is a bank product, not the effective federal funds rate. Banks compete for deposits to different degrees and revise offers on their own timetables. A floating-rate commercial loan can react more quickly if its contract references a short-term benchmark, but the contract's index, reset interval and spread determine the amount and date of the change. The observed 3.88% overnight median cannot be pasted directly onto a household's monthly payment.
There is a related benchmark trap: the secured overnight financing rate measures borrowing backed by Treasury securities, while federal funds are unsecured. Both are overnight rates, but their collateral, participants and transaction sets differ. A news headline that says one rate "fell" should identify which market it measured. If a loan contract cites a specific index, the reader needs that index's reset mechanics rather than a generalized statement about the Fed.
What the Fed documents do and do not say
The September and October statements offer a useful contrast. September's committee unanimously voted for a quarter-point increase, while October held with two members favoring another increase. The October statement emphasized that activity was expanding at a strong pace and that job gains had kept pace with the workforce, but it also retained the judgment that inflation was elevated. The split is evidence of differing policy preferences at one meeting, not a numerical probability of a December move.
The September FOMC minutes describe how market-implied policy expectations had risen before that meeting as economic data, oil-linked inflation concerns and communications shifted. They also describe uncertainty about the longer-horizon policy path. Minutes are a record of the earlier deliberation; they cannot substitute for later data or the October vote. Their value here is to show why yields may move before the policy range changes at all.
The Fed's September economic projections put the median participant projection for the federal funds rate at 4.1% for the end of 2026 and again for 2027, under each participant's assessment of appropriate policy. They are participant projections rather than a binding committee promise. They were assembled before October's hold and before Friday's scheduled employment report. Comparing a current target upper bound of 4.00% with a 4.1% year-end median without noting their distinct definitions creates false precision.
Several forces can pull against each other. If incoming hiring figures weaken materially while inflation eases, investors may mark down the expected path of policy, drawing shorter Treasury yields lower even if the target range stays put today. If wages, spending and inflation prove firmer, the committee could retain or raise its range and markets may price a higher path. Either case is conditional. A market-implied probability is a price-based expectation under a particular contract or model, not a verified future action. Our December rate-odds explainer separates those contract rules from the Fed's actual decision.
The information available before Friday's report includes the Bureau of Labor Statistics' September Employment Situation: payroll employment changed by 29,000 and the unemployment rate was 4.2%. BLS describes two separate surveys, an establishment survey for payrolls, earnings and hours and a household survey for labor-force measures. A payroll headline and unemployment rate can diverge without one of them being fraudulent or "wrong." Their samples, concepts and revisions are different. September's figures describe September, not the unreleased October report.
The previous report also reminds us that a single monthly payroll estimate is noisy. Industry detail, average hours, earnings, labor-force participation and revisions can change the interpretation of the headline. Strong payroll growth paired with weaker hours may have a different implication for income than the same headline with rising hours. A rising unemployment rate can reflect more people entering the labor force as well as job losses. The committee's next choice has to weigh those details against inflation, not just check whether one number beat a forecast.
Evidence for a higher-for-longer reading is the October statement's description of resilient activity and persistent inflation, plus the two votes for an immediate increase. Evidence for patience is the majority's decision to hold pending more information. Neither position implies a guarantee about bonds, stocks or the dollar. Higher expected short rates can make shorter Treasury bills more competitive and put pressure on long-duration valuations, but stronger growth can support earnings at the same time. A lower expected path can aid rate-sensitive sectors, while weak employment behind that move can also hurt their revenues.
That tension is why the policy range is best treated as a reference point, not a standalone market forecast. The currently observed overnight rate tells us where monetary implementation landed on a particular day. It says much less about next quarter's real borrowing costs or whether an equity index is fairly valued. To answer those questions requires growth, inflation, risk-premium and cash-flow assumptions that are outside the federal funds series itself.
What is dated next
As of preparation on the morning of November 6, the BLS release schedule listed the October Employment Situation for 8:30 a.m. Eastern time that day. That release was not yet available at this feature's check. Readers coming later should consult the newly dated BLS release rather than treat September's 29,000 figure as an October result. The most informative comparison will put October payrolls, the unemployment rate and revisions together, then examine hours and earnings before drawing a policy conclusion.
The FOMC calendar lists the next regularly scheduled meeting for December 8 and 9, 2026. The committee normally issues its statement at the end of the meeting. Between now and then, the date on each inflation and labor release matters more than a circulating prediction of the decision. When a new policy statement arrives, read its target range and vote alongside its implementation note; when a new transaction-rate observation arrives, check the New York Fed date and volume.
A clean falsification test for the present picture would be a Fed statement changing the 3.75% to 4.00% target range, or an implementation note changing the operating rates. A market-implied December scenario can change well before either document appears. Conversely, a single effective-rate observation slightly above or below yesterday's observation, while still within the range, does not by itself announce a new policy stance. We will update the reference point when the authoritative documents change.
Frequently Asked Questions
What is the current fed funds rate?
The FOMC's current target range is 3.75% to 4.00% following its October 28, 2026 hold. The separate effective federal funds rate is an observed transaction measure; the New York Fed's page showed 3.88% for November 4 when checked. Always attach a date and say whether you mean the target range or the effective rate.
How is the effective fed funds rate calculated?
The New York Fed calculates the effective rate as the volume-weighted median of overnight unsecured federal funds trades reported in FR 2420. It normally publishes the previous business day's reading around 9 a.m. This is a statistic of completed transactions, not a forecast or a retail bank's quoted interest rate.
Why is the effective fed funds rate below 3.90% interest on reserves?
The reserve-balance rate is paid to eligible institutions, while the federal funds market includes other lenders with different access and costs. Bargaining, eligibility and balance-sheet constraints can leave the transaction median below the rate banks receive on reserve balances. The two series need not match tick for tick.
Does a Fed hold mean mortgage and savings rates will stay the same?
No. A mortgage quote reflects longer-term yields, credit and lending spreads, and market expectations; a savings rate is set by the bank. Either can move while the overnight target stays unchanged. The relationship is a transmission mechanism, not an automatic matching adjustment.
When could the current fed funds rate change next?
The next regularly scheduled FOMC meeting is December 8 and 9, 2026, according to the Fed calendar. The committee can act as conditions warrant, so the calendar is not a promise about the outcome. The October jobs release was still pending at the time this article was prepared and cannot be treated as an observed input yet.
This content is for informational purposes only and does not constitute financial advice. Past performance is not indicative of future results. Consult a qualified financial advisor before making investment decisions.
Get daily intelligence delivered
Create a free account for the Daily Brief every weekday and The Week Ahead every Sunday. No card required.