December Rate Hike Odds Explained Before the December Fed Meeting


December rate hike odds are a market estimate of whether the Federal Reserve will raise its target rate at its December 8-9, 2026 meeting, not a vote count or a Fed forecast. The October 28 decision left the target range at 3.75% to 4.00%; two of the 12 voters preferred an immediate quarter-point increase. That split makes a December increase plausible, but does not make one certain. Our same-day report on the October hold and the market reaction describes an approximately 74% reading on one event contract; this guide explains why that number must be read with its venue, timestamp and settlement rule attached. The Fed's October statement and meeting calendar establish the decision and the next date.
The distinction between an event contract and a futures-implied probability matters here. A contract can ask whether a specified benchmark is above a threshold after the meeting; a futures calculation can estimate a distribution across target ranges. Those are related questions, not interchangeable percentages. CME says its FedWatch tool infers probabilities from 30-day federal funds futures. Before comparing its output with a contract quote, check whether both refer to the same December meeting, the same rate measure and the same set of possible outcomes.
Related reading: Fed decision odds: Polymarket prices a 99.95% hold today as the December hike bet climbs to 81.5%.
How the December question emerged
Start with the policy level rather than the odds screen. The Federal Reserve target upper-bound series published through FRED stood at 4.00% at the end of October 2025, fell to 3.75% by the end of December, held there through August 2026 and returned to 4.00% by the end of September. It remained at 4.00% at the end of October. Those are month-end observations, not a daily account of every intermediate decision. They show why a prospective December hike would extend the more recent upward move rather than merely reverse October's hold.
The October 28 statement is unusually useful for separating outcome from preference. The committee approved a hold by 10 votes to two, while Lisa Cook and Beth Hammack wanted a quarter-point increase at that meeting. A dissenter's position is evidence of a live policy disagreement; it is not a commitment by the other ten voters to move next time. The same statement called economic activity strong and inflation elevated, yet said the committee would accumulate more information before determining the appropriate stance. That language leaves room for a different decision in December without pre-announcing it.
For the broader framework, see our Fed policy coverage.
Readers who followed our September PCE discussion will recognize the inflation side of that argument. Yet one price release cannot settle a two-sided mandate. The last published Bureau of Labor Statistics employment report, covering September, put the unemployment rate at 4.2% and payroll gains at 29,000. The release also said the unemployment rate had remained between 4.1% and 4.3% since March. The weak-looking payroll increment needs to be read with revisions, survey noise and other labor indicators rather than treated as a stand-alone policy instruction.
The September Summary of Economic Projections offers a different lens. Its median participant projection for the federal funds rate was 4.1% at the end of 2026, and its 2026 core PCE inflation median was 3.4%. These are individual participants' judgments of appropriate policy under their own economic assumptions, not a committee target for December and not an odds calculation. The projections were prepared before the October meeting; their chief value today is showing the range of policy judgments behind a single committee statement.
There is also a timing trap. The official Fed calendar lists December 8-9 as a projections meeting and says minutes of scheduled meetings normally arrive three weeks after the decision. The October minutes and new labor data can change what observers think they know before December. An odds estimate captured now is therefore a snapshot of the information set, not the final price at which the meeting will be settled.
What a probability actually prices
Consider a binary event contract that pays if a precisely defined rate threshold is met after the December decision. Its price, often expressed in cents on the dollar, roughly reflects traders' pricing of that defined outcome. A quote around 74 cents is commonly rendered as approximately 74%, but the shorthand hides fees, bid-ask spread, contract wording, participation and liquidity. It also hides which interest-rate measure is tested. The exact contract's rules determine whether a quarter-point increase, an unexpectedly large increase or a move in a different rate measure satisfies it.
That is why we do not present the slate's approximate quote as a freshly verified live price. The public source material retrieved for this piece does not furnish a dated, directly inspectable December contract snapshot with its settlement text. The approximately 74% figure belongs to our already published same-day report, not to a new observation made for this explainer. A reader seeking today's executable market price must inspect the original venue's contract page and time of quote. The analytical point survives a move from 74% to another figure: outcome definition comes before interpretation.
The futures route asks a different question. CME's FedWatch methodology describes how prices of 30-day federal funds futures can be turned into estimated probabilities for target-rate outcomes at FOMC meetings. Futures settle on the month's average effective federal funds rate, while the policy announcement states a target range. To translate one into the other, the calculation has to account for the meeting date within the month and assumptions about the effective rate's position within the target range. A December contract that settles on a month-end level is not automatically measuring the same thing.
The New York Fed's effective federal funds rate page defines that benchmark as the volume-weighted median of reported overnight federal funds transactions. Its publication reflects the previous business day of transactions, not a direct reading of a committee ballot. The Fed controls its target range and implements policy through administered rates and market operations; the effective rate is an observed transaction benchmark. Treating the target upper bound, the effective rate and a futures monthly average as one identical number can produce a convincing-looking but wrong probability comparison.
Suppose a screen labels the chance of a rate above 4.00% in December. If the starting target upper bound is 4.00%, a standard quarter-point hike would take the upper bound to 4.25%. But the phrase 'above 4.00%' might instead refer to an effective-rate threshold or to a particular daily reference date. A hold at 3.75% to 4.00% and a quarter-point hike to 4.00% to 4.25% are clean policy scenarios; whether a contract separates them cleanly depends entirely on the instrument specification. Never infer that all displayed 'hike odds' share the same denominator.
Probabilities are also sensitive to what a market allows participants to express. A binary 'hike or not' screen compresses a hold and a cut into the same losing side of a hike contract. A futures distribution might separately show a cut, a hold and several hike sizes. If a binary price drops after a soft employment report, the shift need not mean the market suddenly favors a cut. It may simply assign more weight to a hold. Comparing the full ladder rather than one headline percentage tells you which scenario absorbed the change.
Liquidity is the final caveat. A visible last trade can be old; a narrow order book can move on a small transaction; bids and asks can straddle the displayed last price. A high percentage can therefore mean strong aggregate pricing, a thin market with a wide spread, or both. For an institutional reader and a household reader alike, the useful discipline is the same: read the contract terms, identify the reference rate, note the timestamp, inspect available depth and compare the alternative outcomes. None of that turns a market quote into a Fed announcement.
The rate path behind the chart
The chart below plots the month-end upper bound of the Fed's target range from October 2025 through October 2026. We took the observations directly from the FRED DFEDTARU series on November 2 and aggregated to the end of each month. The series falls from 4.00% in October 2025 to 3.75% in December 2025, stays at 3.75% through August 2026 and rises to 4.00% in September. It remains at that level in October. Those dates matter: the graphic describes actual policy history, not a forecast of the December decision.
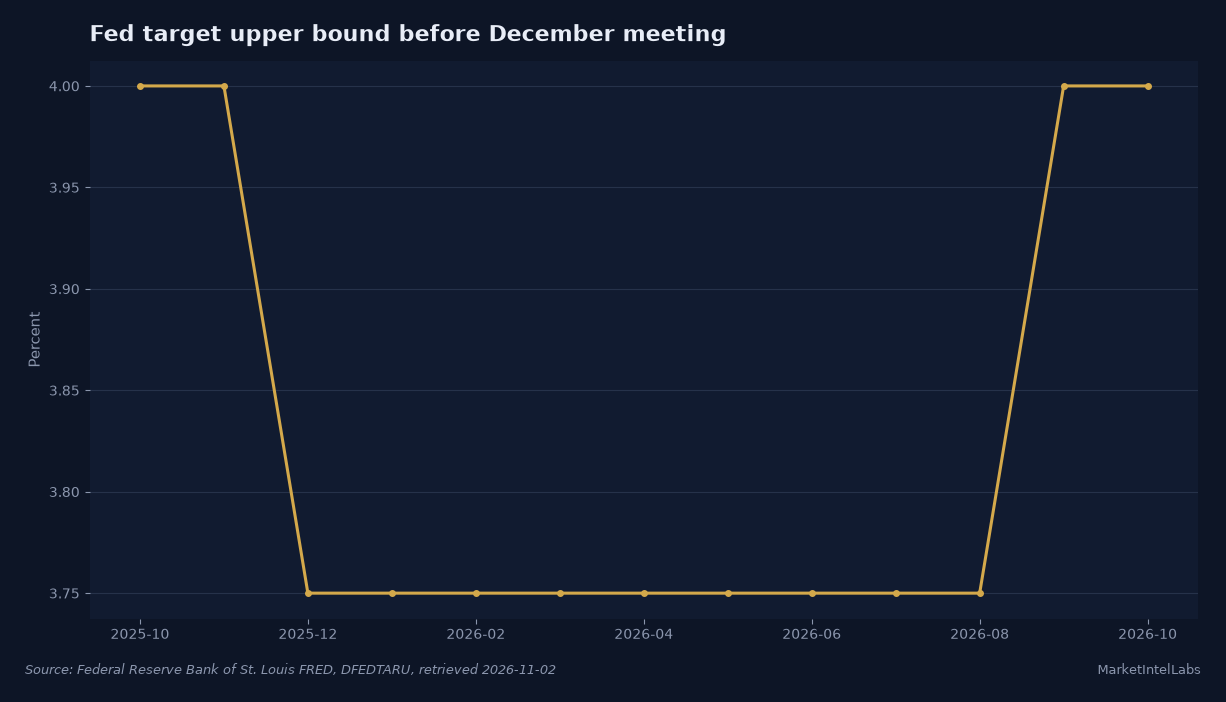
This is a useful anchor for interpreting the odds ladder. The current 3.75% to 4.00% range is the baseline against which a December hold or hike should be measured. A quarter-point increase would place the range at 4.00% to 4.25%; a hold would leave it unchanged. The chart deliberately does not append either hypothetical as an observed point. Mixing a projected value with a historical line would make a market scenario appear to be a Fed decision.
Month-end sampling also has a limitation. A rate move early in a month and one late in a month can leave identical month-end chart points while implying different monthly futures settlements. The December meeting is scheduled for the second week of the month, so its timing matters to a contract on December's average effective rate. This is one reason a futures-implied probability can shift even when the current target upper bound has not changed at all. The chart supplies the starting level; the instrument's methodology supplies the forecast mechanics.
What the official documents do and do not say
The Fed's October 28 statement is a record of a hold and of two stated preferences for an immediate increase. It is not a December guidance document promising either a hike or a hold. Its observation that inflation remains elevated supports the case for tighter policy if later data sustain the pressure. Its reference to accumulating information supports a different case: policymakers can wait if inflation or labor data make immediate tightening less attractive. Both propositions are in the same primary document.
The September projection tables are not a probability forecast either. The published median for year-end 2026 is a median across participants, each of whom was asked to specify appropriate policy given an individual economic projection. A median can change at the December projections meeting, and it does not disclose which participant will vote for a particular option. Comparing an old median to a new event-contract price is informative about shifting expectations, not evidence that one of the two is 'wrong.'
The September BLS report gives the labor side of the ledger: 29,000 payroll jobs added and a 4.2% unemployment rate. The household and establishment surveys measure different populations and can diverge in any one month. A strong October hiring figure would strengthen the case that demand can tolerate a higher rate; another weak figure or adverse revisions would weaken it. The direction of those conditional arguments is analysis, not a claim that the Fed will respond mechanically to one release.
Finally, CME's own description says FedWatch probabilities are implied by 30-day futures, while the New York Fed's benchmark description specifies what actually trades in the underlying federal funds market. Those documents explain why a derived probability may differ from the percentage attached to a venue's event contract. Neither source supplies a basis for silently converting one venue's live price into another venue's official odds.
What can change before December
The first dated labor input is the September Job Openings and Labor Turnover Survey, scheduled by the BLS November calendar for Tuesday, November 3 at 10:00 a.m. Eastern. Openings measure employer demand, but hires, quits and layoffs can tell a different story from the top-line count. A higher openings total alongside weak hiring would not be the same signal as both openings and hiring accelerating. The odds market may move on the release; the Fed will still have more data before December.
The larger scheduled test this week is the October employment report, due Friday, November 6 at 8:30 a.m. Eastern on the same BLS calendar. Compare the payroll change with September's 29,000, the unemployment rate with September's 4.2%, and revisions to prior months with both. Those are observed reference points, not predictions for October. A positive payroll surprise with stable unemployment would reinforce one part of the October statement; further slowing in hiring could make its inflation warning less decisive in the next meeting discussion.
The next inflation test is the October consumer price index, set for November 10 at 8:30 a.m. Eastern by BLS. The Bureau of Economic Analysis calendar schedules the October personal income and outlays release, which includes PCE inflation data, for November 25 at 8:30 a.m. Eastern. CPI and PCE are not the same index. If one accelerates while the other cools, the committee will need to interpret their different weights and coverage rather than follow a single headline. Each release could change the composition of market-implied outcomes.
There is a disciplined way to update the story after each print. Record the pre-release quote and its timestamp; identify the contract's exact December settlement rule; then record the post-release bid and ask alongside any change in the futures-implied distribution. If a hike quote falls but hold odds rise, call it a shift toward holding, not an unexplained loss of faith in the Fed. If both inflation and labor readings strengthen, explain why the market can price a higher policy rate without treating a conditional response as certain.
Our calendar of this week's major releases supplies the broader context for investors juggling several events. For this feature, the relevant deadline remains December 8-9. The answer worth following is not whether a screen can print 74% this morning; it is whether its defined hike outcome still commands a similar price after the November 6 jobs release and the November 25 PCE report, with the underlying target range still anchored in the official Fed record.
Frequently Asked Questions
What are December rate hike odds?
They are market-derived estimates of a defined rate outcome at or after the Fed's December 8-9 meeting. An event contract's price refers to its own settlement condition; a futures-implied probability refers to a calculation from interest-rate futures. Neither is a formal prediction from the Fed. Read the instrument's definition and the time of the quote before repeating a percentage.
When is the next Fed rate decision in December 2026?
The Federal Reserve calendar schedules the FOMC meeting for December 8-9, 2026. It is designated as a meeting with a Summary of Economic Projections. The committee has not made that decision as of November 2, and market prices before the meeting can change with new information.
Does a 74% hike probability mean the Fed will raise rates?
No. Roughly 74% was a market reading described in our November 2 reaction piece, not a guarantee or a verified live cross-venue consensus in this guide. The percentage depends on the contract, market depth, time and outcome definition. A market that favors a hike can still settle on a hold, and a different venue can report a different number without either necessarily misreporting its own instrument.
What is the current Fed rate before the December meeting?
Following the October 28 vote, the Fed target range is 3.75% to 4.00%. The upper bound was also 4.00% at October month-end in the FRED target upper-bound series. That is a policy range, not the same object as an individual bank loan rate, the effective federal funds rate or an event-contract price.
What data could change December Fed odds next?
The BLS calendar sets September job openings for November 3, the October jobs report for November 6 and October CPI for November 10. The BEA calendar lists October personal income and outlays for November 25. New inflation or employment readings can shift market prices in either direction before the December 8-9 meeting. Compare each move with the prior quote and the precise outcome being priced.
This content is for informational purposes only and does not constitute financial advice. Past performance is not indicative of future results. Consult a qualified financial advisor before making investment decisions.
Get daily intelligence delivered
Create a free account for the Daily Brief every weekday and The Week Ahead every Sunday. No card required.