September CPI Explained: August Inflation Was 3.4% Before the October 14 Release


September CPI has not been released as of 10:00 UTC on October 14, 2026. The Bureau of Labor Statistics is scheduled to publish it at 8:30 a.m. Eastern, or 12:30 UTC. The latest official reading is August: headline consumer prices rose 0.4% for the month and 3.4% over 12 months, while prices excluding food and energy rose 0.3% for the month and 2.4% over 12 months. The first question for this morning is not whether an unreleased number beat a forecast. It is whether September's energy pressure shows up mainly in the headline or spreads into the more persistent categories the Federal Reserve watches.
Our September CPI preview sets out the pre-release debate. The September FOMC minutes explainer supplies the policy backdrop. Neither an expectation nor a market forecast should be treated as a BLS result before BLS publishes the report. This explainer uses the last available official data and separates the forecast from the measurement. After release, the September BLS table, not a headline written early, is the authority. The BLS CPI release still showed August 2026 as its current result when this article was drafted.
Related reading: September CPI Report Preview: Energy Headline vs Cooling Core, the Print That Decides October Hike Odds.
How we got to this morning's inflation test
The August report offers an unusually useful starting point because it shows how two true statements can give readers different impressions. The all-items index was up 3.4% from August 2025. The index excluding food and energy was up 2.4% over the same interval. Headline exceeded core by a full percentage point. But the monthly gap was smaller: all items rose 0.4% and core rose 0.3%, both seasonally adjusted. A year-over-year number carries eleven earlier months into the comparison, while a monthly number concentrates attention on the latest observations.
Energy explains much of the divergence. BLS reported that August's energy index rose 2.1% from July and 16.3% from a year earlier. Gasoline increased 3.9% over the month and 27.4% over the year, with gasoline accounting for more than one third of that month's increase in the all-items index. Those are observations, not September estimates. An oil-market shock can make the 12-month comparison look stubborn even while some nonenergy services are growing at a different pace. It can also change households' actual spending pressure immediately, regardless of how analysts classify it.
For the broader framework, see our Fed policy coverage.
The earlier path was hardly smooth. In the August BLS release's Table A, seasonally adjusted headline changes from February through August were 0.3%, 0.9%, 0.6%, 0.5%, negative 0.4%, 0.1%, and 0.4%. Over the same months core changes were 0.2%, 0.2%, 0.4%, 0.2%, zero, 0.2%, and 0.3%. The large March headline rise and the June decline illustrate why a single monthly print should not stand in for the underlying trend. The September figure, once public, will extend that sequence rather than replace it.
August's shelter index rose 0.3% from July after rising 0.1% in July, and was up 3.0% from a year earlier. This matters because shelter is a large component rather than a niche price series. The BLS expenditure table gives shelter a relative importance of 35.343% in the July 2026 basket. A small movement in a heavily weighted category can matter more to the aggregate than a dramatic percentage move in a tiny category. By contrast, fuel oil had a relative importance of 0.107%, even though its August year-over-year increase was 52.0%.
Food tells a different story again. The August food index gained 0.1% for the month; the food-at-home index was unchanged and was 2.2% higher than a year earlier. Food away from home gained 0.3% in August and 3.4% over 12 months. These are not interchangeable descriptions of a grocery bill. Rent, gasoline, a restaurant meal, and household staples move on different timetables, which is precisely why an aggregate should be read beside its components. A household whose biggest spending category differs from the statistical basket can experience a very different personal inflation rate.
How the CPI number travels through markets and household budgets
CPI is built from prices collected across the month, not from a single snapshot on release day. BLS says the series follows consumer out-of-pocket prices, typically including sales and excise taxes, and samples goods and services purchased by urban consumers. A headline number is an average built with expenditure weights. It can therefore be both economically important and a poor description of any one family's receipts. A driver commuting long distances will feel gasoline more acutely than a household without a car, even though both households read the same national figure.
The BLS calculation chapter describes a system of geographic areas and item categories rather than a simple average of price tags. It describes 32 index areas and 211 item strata, plus the detailed procedures needed for replacement items and quality changes. When the price of a product changes because its features change, the agency has to distinguish a price move from a difference in what was bought. That complexity is not grounds for ignoring CPI. It is a reason to avoid pretending that a one-decimal monthly number is a laboratory reading of an otherwise fixed object.
Core CPI excludes food and energy, whose prices can change quickly. Exclusion is an analytical choice, not a claim that food or gasoline do not matter. For a household, a fuel jump is real. For policymakers asking whether broad inflation will remain high after a supply shock fades, the question is whether price pressure spreads to shelter, medical services, goods, and other categories. In August, for example, gasoline was up sharply, yet core was 0.3% monthly. Neither series alone answers whether September brought broadening price increases.
The route from CPI to interest rates is indirect. Investors revise expectations for future Federal Reserve decisions when the data change the likely inflation path. Shorter-maturity Treasury yields can react to the anticipated policy path; longer yields also reflect expected inflation, growth, and compensation for holding duration. Mortgage pricing may then move with bond yields, but no published CPI percentage dictates a fixed mortgage rate. Our fed funds rate explainer separates the policy target from a market rate, a distinction worth keeping when an inflation release makes every rate chart move at once.
The Fed has another reason not to act on a single CPI reading mechanically: it aims for inflation measured by the personal consumption expenditures price index, not CPI itself. Both are useful, but their baskets and methodology differ. The September Summary of Economic Projections records the committee participants' projections for PCE inflation and a 2.0% longer-run objective for overall PCE inflation. These are projections submitted in September, not an October rate decision or a September CPI forecast.
For workers, one more calculation matters. Nominal pay rising is not the same as purchasing power rising. In its August real earnings release, BLS reported real average hourly earnings for all private nonfarm employees fell 0.1% from July to August because a 0.3% nominal hourly earnings increase met a 0.4% CPI increase. That is an observed monthly comparison and illustrates the mechanism cleanly. The September real earnings release is due at the same 8:30 a.m. Eastern release time as September CPI, so those figures should be read together once both exist.
Annual CPI also affects policy and contract calculations outside financial markets. The BLS concepts chapter lists Social Security and other federal payment adjustments, tax bracket adjustments, and private wage and rent escalators among uses of CPI. But a contract may specify a different CPI series, base month, or adjustment convention. The 3.4% August CPI-U annual rate should not be pasted into a person's benefit or lease calculation without reading the applicable formula. Interpretation starts with the exact index named, then the relevant observation period.
The market risk is symmetrical. If September's core monthly increase exceeds the expectation being discussed before publication and service categories broaden, investors could infer more persistent inflation and push the expected policy path higher. If the headline is lifted mainly by energy while shelter and other core categories ease, the apparent heat may say less about sustained pressure. Neither reading guarantees a Federal Reserve response. A weak labor signal could pull in the other direction, and the Fed's own September documents show it considers both price stability and employment.
The chart: what the last released months actually show
Before looking at any September commentary, look at the official run of monthly changes through August. The chart below reproduces the headline and core monthly changes from BLS Table A, with no September point. March's 0.9% headline jump and June's negative 0.4% show the scale of energy-sensitive swings; core moved in a narrower range, from zero to 0.4% across the same seven months. The paired series are a check against an argument built on one release. They are not a forecast of the next point on either line.
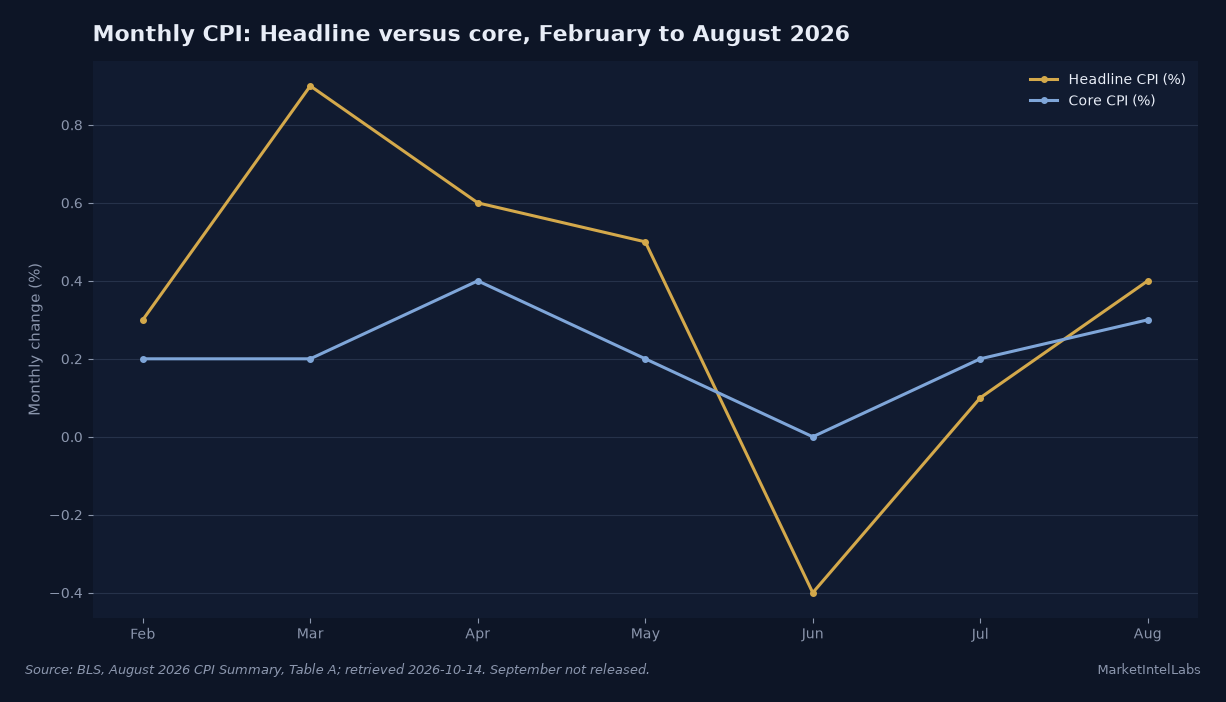
Here is the source table behind our chart, expressed as percent change from the previous month, seasonally adjusted. February 2026: headline 0.3, core 0.2. March: headline 0.9, core 0.2. April: headline 0.6, core 0.4. May: headline 0.5, core 0.2. June: headline negative 0.4, core zero. July: headline 0.1, core 0.2. August: headline 0.4, core 0.3. August's separate year-over-year comparison is headline 3.4% and core 2.4%. The September actual, its month-over-month change, and its 12-month change are all unpublished at the drafting time of this feature.
Those decimal differences are economically meaningful but can also be exaggerated by commentary. A 0.1 percentage point gap between a forecast and a release is not a complete account of inflation. Read the underlying category contributions and whether the forecast was for the adjusted monthly figure or the unadjusted annual one. Compare the new figure with August and with the month a year before, since year-over-year inflation can shift as an old extreme observation rolls out. This last effect is often called a base effect; it does not tell you how much today's groceries cost.
What the primary documents say, and where they disagree
The September FOMC statement says the committee voted 12 to 0 to lift the federal funds target by a quarter percentage point to 3.75% to 4.00%. It described inflation as elevated and said the move supported a timelier return to its 2% goal. That is the most recent completed FOMC decision, not a decision already taken in response to September CPI. The release predates the October 14 BLS report. Any story saying the Fed has already reacted to today's September print is running ahead of the evidence.
The minutes of that meeting supply the nuance missing from an up-or-down rate headline. They say near-term inflation compensation had risen largely with oil prices, while longer-term inflation expectations remained stable at levels consistent with the committee's longer-run objective. The minutes also describe higher Treasury yields across the two- to ten-year sector and attribute part of the increase to a higher expected policy path, while discussing other factors such as term premiums. A September CPI surprise can therefore change one part of the yield story without being the whole story.
There is a second distinction in the Fed projections. The September PCE and core PCE projections are views about an entire year's price change under participants' own policy assumptions. They do not say that September CPI will be 3.7% or that the October meeting must raise rates. The median projected appropriate federal funds rate for 2026 is a year-end projection rather than a binding vote by the committee. An investor can reasonably read the projections as evidence of inflation concern, but should not recast a distribution of participants' forecasts as a promise.
The BLS evidence puts weight on both sides of the argument. Energy's 16.3% 12-month rise in August supports concern that headline inflation was hurting purchasing power. The core CPI annual rate of 2.4% supports a different statement: excluding food and energy, this CPI series rose much less quickly than the headline over the same period. Still, core's August monthly increase of 0.3% was above July's 0.2%. It would be an error to describe a cooler annual core rate as proof that monthly pressure vanished. The apparent disagreement disappears once the measures and comparison periods are named.
There is a measurement disagreement between a national basket and a family's experience. The BLS Handbook calls CPI an approximation of a cost-of-living index, not an observation of every household's fixed standard of living. The relative-importance table makes that tangible: shelter carried over a third of the CPI basket, while energy was just over 7% in July. A household locked into a fixed mortgage and commuting long distances has a different exposure from the average. Readers should use CPI to understand national price movement and the appropriate component index to investigate a specific expense.
What happens next
The September CPI and September real earnings releases are scheduled for Wednesday, October 14, at 8:30 a.m. Eastern. The publication time comes from the BLS August CPI release and the BLS real earnings schedule in its August release. When BLS updates the CPI page, the first check is whether the headline and core monthly results can be matched to the agency's own table. Next examine gasoline, shelter, and services, followed by the official real-pay calculation. A same-day trading narrative is not a substitute for this sequence.
The practical question after 8:30 is precise: did the newly released core figure, supported by its components, confirm the August pattern of 0.3% monthly growth, or depart from it? If the report is not yet out when you read this, every September number in a headline is a forecast or an unsupported claim. Once it is out, use BLS to replace the unknowns, and keep the August chart dated. This article will not fill an empty September column with a number borrowed from an early story.
Frequently Asked Questions
What time does the September CPI report come out?
The BLS scheduled the September 2026 Consumer Price Index report for Wednesday, October 14, 2026, at 8:30 a.m. Eastern, or 12:30 UTC. At 10:00 UTC that morning it had not yet been released. Check the dated official BLS release for the first reported result rather than treating a preview as an actual number.
What was the latest CPI before the September report?
August 2026 was the latest released month as of 10:00 UTC on October 14. BLS reported headline CPI up 0.4% from July and 3.4% from a year earlier; core CPI, excluding food and energy, rose 0.3% monthly and 2.4% annually. Those four figures belong to August, not September.
What is the difference between headline and core CPI?
Headline CPI covers the full BLS consumer basket, including food and energy. Core CPI removes food and energy to help readers assess price pressure beyond two categories prone to sharp swings. Core does not replace the price changes households actually pay. In August 2026, gasoline's 3.9% monthly increase lifted headline CPI, while the core monthly increase was 0.3%.
Does a high September CPI mean the Fed will raise rates?
No single CPI reading dictates a Fed vote. In September 2026 the FOMC voted to lift its target range to 3.75% to 4.00%, before the September CPI report was available. A new CPI result can change policymakers' and investors' assessment of persistent inflation, especially if core categories broaden, but the Fed also weighs employment, inflation expectations, and other information before a later meeting.
Why does CPI matter if the Fed targets PCE inflation?
CPI is a timely measure of consumer price changes and directly enters some benefit, contract, and real-earnings calculations. The Fed's 2% inflation objective refers to PCE inflation, which is measured differently. CPI can inform the inflation outlook without being interchangeable with PCE or being the sole input to the Fed's policy decision.
This content is for informational purposes only and does not constitute financial advice. Past performance is not indicative of future results. Consult a qualified financial advisor before making investment decisions.
Get daily intelligence delivered
Create a free account for the Daily Brief every weekday and The Week Ahead every Sunday. No card required.