Fed Funds Rate Today: 3.75% to 4.00%, October Odds Favor Hold


The federal funds target range today is 3.75% to 4.00%. The Federal Open Market Committee raised it by 25 basis points on September 16, effective September 17, according to its statement and the Fed's target-rate history. The New York Fed reports an effective federal funds rate, or EFFR, of 3.88% for October 7, the latest observation available at this October 8 check, in its daily rate data. The Fed pays 3.90% on reserve balances under the September implementation note.
The next scheduled decision is October 27 to 28. At about 14:40 UTC on October 8, the Kalshi October decision market API showed last prices of 84 cents for no change and 17 cents for a quarter-point hike. The Polymarket Fed rates dashboard displayed about 84% no change and 17% for a quarter-point hike at the same check.
Related reading: RBI Rate Hike Odds Resolve YES After October 7 Decision.
Neither displayed figure is a forecast from the Fed. CME FedWatch derives a separate implied path from 30-day federal funds futures, but its live numerical October distribution could not be retrieved reliably at this check; we will not invent a CME percentage. For today's speech and the released minutes, read our Waller coverage and September minutes analysis. This feature explains what the rates and the market contracts measure.
The target is a range; the traded rate is a print
A search for the current fed funds rate can return 4.00%, 3.88% or 3.90%, each correct in its own context. The FOMC chooses a range for overnight unsecured lending of reserve balances between eligible institutions. The Federal Reserve's open-market operations guide records its upper and lower bounds, and the September decision specifies the latest increase.
For the broader framework, see our Fed policy coverage.
Related reading: JOLTS, PCE and payrolls will test the 66% October hike odds.
A range is not a promised transaction price. Banks negotiate transactions at rates that can differ by counterparty and time of day.
The New York Fed's EFFR methodology defines the effective rate as the volume-weighted median of transactions reported on the FR 2420. For October 7, its daily feed lists a 3.88% median and $108 billion of reported volume, with the 25th percentile at 3.87% and the 75th at 3.88%. The distribution matters: a single printed rate hides the fact that not every transaction settled at that exact level. The data are published after the trading day, so an October 8 reader should not call 3.88% an October 8 transaction print.
IORB is another object. Under the implementation note, the Board raised interest on reserve balances to 3.90% effective September 17. Eligible banks earn this administered rate on balances at the Fed.
A bank has less reason to lend reserves cheaply when it can earn IORB instead, but not every federal funds lender is eligible to receive IORB. That asymmetry helps explain why a transaction median can sit at 3.88%, two basis points below IORB, without implying the Fed missed its target.
These distinctions matter when a news alert says the Fed rate has moved. A new target is an FOMC decision. A change in IORB is a Board-administered implementation setting.
A move in EFFR is observed market trading. The three usually move together after an ordinary policy decision, but they need not match digit for digit. The September quarter-point increase lifted the range and IORB on the specified effective date, while the subsequent overnight print reflects transactions rather than a committee vote.
The 2024 to 2026 path, measured two ways
The longer path reverses twice. The Fed's rate history shows a 5.25% to 5.50% range before the September 2024 reduction. The upper limit fell to 5.00% on September 19, 2024, 4.75% on November 8 and 4.50% on December 19.
It moved to 4.25% in September 2025, then 4.00% in October and 3.75% in December. September 2026 took the upper limit back to 4.00%. Put simply, the latest hike reverses one 2025 quarter-point cut; it does not restore the 2024 peak.
Our original chart plots the official target upper bound beside the daily effective rate from the Federal Reserve Bank of St. Louis DFEDTARU and DFF series retrieved October 8. At the beginning of 2024 the upper bound was 5.50% and EFFR was 5.33%.
Following the first large reduction in September 2024, the September 19 values were 5.00% and 4.83%. On December 19, 2024, they were 4.50% and 4.33%. On September 17, 2026, the upper bound was 4.00% and the effective rate was 3.88%. As of 14:40 UTC October 8, the upper-bound series includes October 8; the chart's DFF series stops at October 6 because FRED did not yet show the newer New York Fed October 7 print.
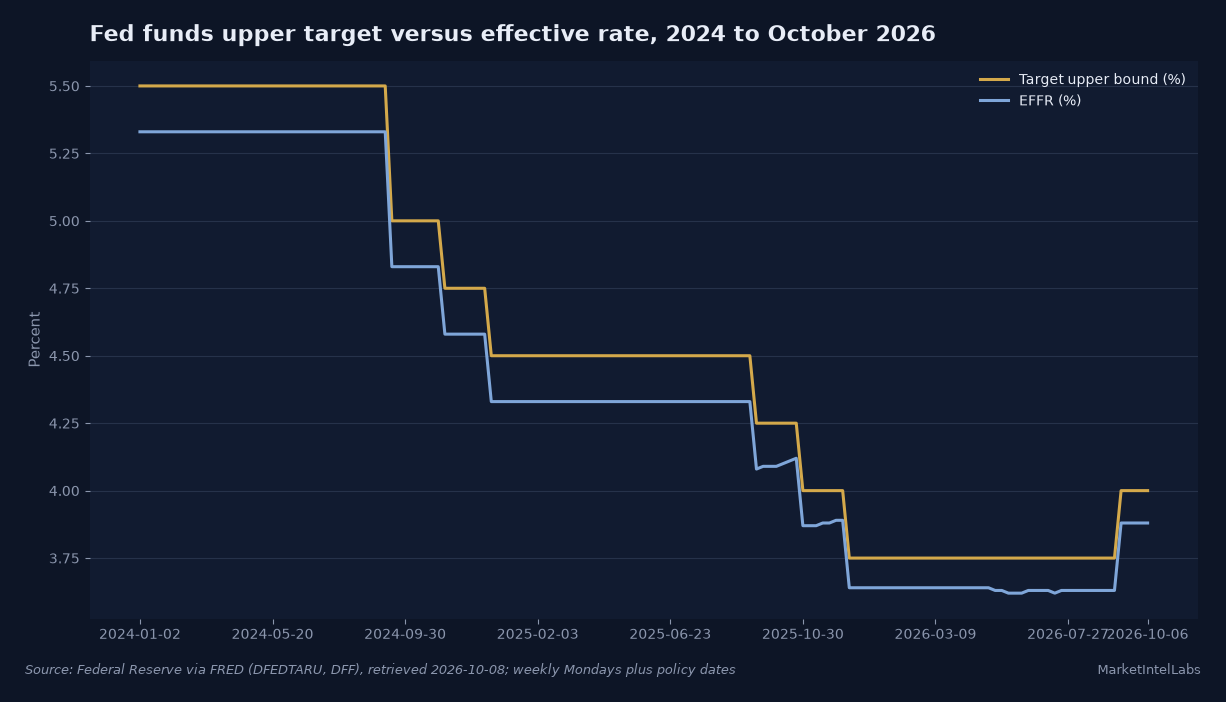
The gap between the two lines is structural. Comparing the effective print against the upper bound alone makes it look as if the market is perpetually trading below policy, but the FOMC has specified a range, not a single rate at the top. The more useful test is whether observed transactions stay inside the band and how far they sit from the administered rates.
The October 7 effective 3.88% is 13 basis points above the lower limit and 12 below the upper limit. That is an observation about implementation, not a signal that another hike has happened.
The historical dates in the Fed history are effective dates rather than necessarily the day of the news conference. That explains why September 16, 2026 is the announcement date and September 17 is the line's step. A chart labeled only by announcement date can misplace a daily observation and suggest the overnight market anticipated a decision that was already public. We use the change date on the official target series and report the press release separately.
What the Fed has said, and what the dots cannot say
The September FOMC statement says the 25-basis-point increase had unanimous support, with a 12 to 0 vote. It describes solid economic activity, resilient spending, strong productivity growth and inflation that remains elevated. That is the committee's explanation for raising the range, not a promise to repeat the move at its next meeting. The statement also says the Fed is maintaining ample reserves, relevant to why it relies on administered rates instead of trying to ration scarce reserve balances every day.
The September Summary of Economic Projections accessible tables give a median projected federal funds rate of 4.1% at the end of 2026, versus 3.8% in the June projections. For 2027 the September median is also 4.1%, and for 2028 it is 3.9%. These are individual participants' assessments of appropriate policy under their own assumptions, not a single FOMC forecast or a precommitted voting schedule.
The published table also puts 2026 median headline PCE inflation at 3.7% and core PCE at 3.4%. Both exceed the 2% longer-run inflation objective, explaining the pressure to leave a restrictive setting in place.
Governor Christopher Waller's October 8 economic-outlook remarks in Istanbul offer a sharp distinction between direction and timing. He says he anticipates additional hikes if data arrive as expected, but that they need not occur at consecutive meetings. He also reads the September dots as 16 of 18 participants anticipating at least one more hike in the remaining two 2026 meetings, with four of those 16 expecting two.
That is his interpretation of the distribution, not an official decision by the committee. The statement sets the current rate; an individual speech informs the debate around a future one.
This is why a reader should resist translating the 4.1% year-end median into “October will be a hike.” The published dot is an end-of-year level. October and December are separate meeting dates, and an end-point cannot tell us which meeting supplies a change. The median participant can change an individual projection when inflation or employment data change, and the membership of the committee that votes differs from the wider group that submits projections. For the actual September hike and what its minutes disclose, the linked reporting above is the better account.
Reading October odds without confusing markets
CME FedWatch estimates meeting outcomes from prices of 30-day federal funds futures. The contract settles on the monthly average effective funds rate, so October's futures price blends days before and after the October 27 to 28 meeting. To infer a meeting change, the model adjusts for the calendar and the current EFFR.
The resulting percentages depend on a pricing model and change as futures trade. At this check the public page explained the method but did not expose a reliable current numerical October table to our fetch. Treat CME as a methodology reference here, not as an unverified third numeric quote.
The Kalshi public API offered a different lens at about 14:40 UTC October 8: last traded prices of 84 cents for “Fed maintains rate,” 17 cents for “Hike 25bps,” and one cent apiece for three smaller cut or larger-hike alternatives. These are separate binary contracts with bid-ask spreads. Their last prices do not have to add neatly to 100 cents, and a last trade need not equal the price available for the next trade. The market's rules page resolves the alternatives by what the Fed does on October 28, not by where the year-end median dot lands.
The Polymarket rates dashboard displayed 84% for no change and 17% for a 25-basis-point increase, with each cut or larger hike below 1%, at the October 8 check. It labels the outcome on its page “Thu Oct 29,” whereas the Fed's official meeting schedule says October 27 to 28. We use the Fed calendar for the meeting date and do not reinterpret the dashboard's display date as a different FOMC meeting.
Kalshi and Polymarket figures are contemporaneous snapshots from different order books, not interchangeable official probabilities. Neither is a recommendation to take a position.
Why can the dots lean toward additional tightening while near-term contracts favor a hold? The clocks differ. The dots ask for an appropriate rate at year-end; October contracts ask for a decision at one meeting.
An investor can expect a December increase without expecting one in October. Even for the same meeting, a 17-cent yes price reflects contract terms, fees, liquidity and risk, as well as participants’ assessments. It is better to call it a market-implied indication than to call it a 17% certainty.
The numbers can also move faster than the Fed publishes a statement. A speech, inflation report or employment print may change what traders will pay for an October outcome without moving the current 3.75% to 4.00% target at all. Conversely, an announcement can change the target while an illiquid last trade lags.
Readers looking for “fed funds rate today” need the official setting first, the realized EFFR second and the priced path third. Blending them into a single “Fed rate” erases the distinction that makes market reaction legible.
What would change the October picture
The next formal decision is scheduled for October 27 to 28, per the FOMC calendar. A new statement can move the target range immediately or set an effective date for implementation. Until that decision, any quoted target of 3.75% to 4.00% remains the current policy setting unless the Fed announces an unscheduled change. The current EFFR will continue to be a dated daily series, not a forward promise.
The Fed's September projections imply inflation is still the tighter constraint: median headline PCE at 3.7% and core at 3.4% for 2026 leave substantial distance from 2%. The case for another near-term increase strengthens if subsequent inflation data support that assessment and activity remains firm. The case for waiting strengthens if disinflation resumes or labor conditions deteriorate enough to increase the cost of additional restraint. Those are conditional interpretations of the Fed's stated objectives, not forecasts of a specific unpublished print.
Watch the next EFFR observations against the target corridor and 3.90% IORB, not merely against yesterday’s EFFR. A drift inside the range says something about the distribution of overnight funding trades; a target change requires an FOMC action. Ahead of October 28, compare dated snapshots from each market with its own earlier snapshot rather than stitching prices from different times into a false trend.
The Fed statement will settle what policy is. Odds only tell us what participants were willing to price before it.
Frequently Asked Questions
What is the fed funds rate today?
The current FOMC target range is 3.75% to 4.00%, set September 16 and effective September 17, 2026, in the Fed statement. The latest realized overnight EFFR available at the October 8 check is 3.88% for October 7, per the New York Fed. The target is a policy band; EFFR is a market observation.
What is the current effective federal funds rate?
The New York Fed daily feed puts October 7 EFFR at 3.88% on $108 billion of reported transactions. It is a volume-weighted median of eligible overnight trades, published after the effective date. Check the observation date when quoting it: a page viewed October 8 can still display the October 7 rate.
What is the interest rate on reserve balances today?
IORB is 3.90%, effective September 17, according to the Federal Reserve implementation note. It is paid on reserve balances held at the Fed by eligible institutions. It is not the upper bound of the FOMC's 3.75% to 4.00% target range, nor the same thing as the 3.88% EFFR transaction median.
Will the Fed raise rates at the October 2026 meeting?
No decision has been made for the October 27 to 28 FOMC meeting. At the October 8 check, Kalshi last trades put a quarter-point hike at 17 cents and a hold at 84 cents; Polymarket showed roughly 17% hike and 84% hold. Prices can change and do not establish a future outcome. The September dot plot implies more tightening by year-end for many participants but does not specify October.
Why is the EFFR below the Fed target upper bound?
The FOMC targets a range, not its upper endpoint. The October 7 effective rate of 3.88% lies inside 3.75% to 4.00%; its distance from 4.00% is not evidence of a policy miss. The New York Fed methodology computes EFFR from actual trades, while the Fed implementation note sets IORB at 3.90% to help control overnight rates.
This content is for informational purposes only and does not constitute financial advice. Past performance is not indicative of future results. Consult a qualified financial advisor before making investment decisions.
Get daily intelligence delivered
Create a free account for the Daily Brief every weekday and The Week Ahead every Sunday. No card required.