Mortgage Rates Fall to 7.18%, but a Buyer's Buying Power Stays 9% Below a Year Ago

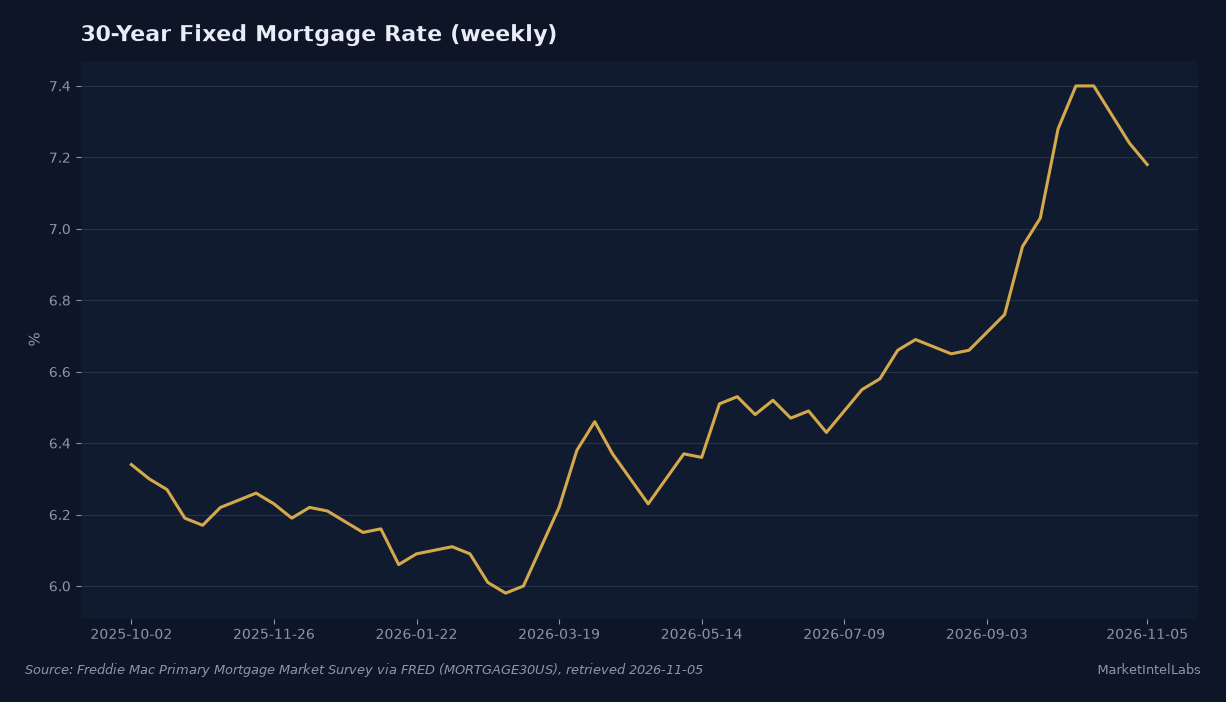
The weekly mortgage rate finally moved in a buyer's favor. Freddie Mac's Primary Mortgage Market Survey put the average 30-year fixed rate at 7.18% on Thursday, its lowest reading since the week of September 24 and a clear step down from the 7.40% peak that held through early October. The reprieve is real. It is also small, and the demand data that landed the day before says buyers are not yet acting on it.
What the rate move is worth comes down to payment math. Take the $432,900 median sale price from the third quarter. A 20% down payment leaves a $346,320 loan, and at 7.18% the principal-and-interest payment is about $2,346 a month. That is $52 below where it stood at the 7.40% peak, a modest but real step back. The harder comparison is to a year ago: rates around 6.2% in November 2025 put that same loan at roughly $2,126 a month. Today's buyer is still paying about $220 more per month, or roughly 10% more, for the same house and the same down payment.
Related reading: Mortgage Rates Fall to 7.24%, Lowest in Five Weeks.
Turn the same payment around and the damage shows differently. A buyer whose budget is fixed at $2,346 a month could have carried about $478,000 in home price a year ago at 2025's lower rates. At 7.18% the same payment supports a price close to $433,000. That is a loss of roughly $45,000 in purchasing power in twelve months, even after three weeks of falling rates. The rate easing is real, but it has not come close to restoring what higher rates took away since last fall.
The demand side of the market is not celebrating yet. The Mortgage Bankers Association's weekly survey, covering the week ending October 31 and released Wednesday, showed the seasonally adjusted purchase index down 2% week over week, with unadjusted purchase applications down 4% and a full 19% below the same week a year ago. Refinance activity ticked up 0.1% week over week but remains about 60% lower than a year earlier, held down by the roughly 7% rates that have prevailed for much of this year. The refinance share of activity edged higher to 39.8%, but the story is a market waiting for a bigger rate break, not responding to this one.
Related reading: MBA Mortgage Applications Fall 4.2% as Rates Hit 7.49%.
Supply is the one part of the equation working in a buyer's favor, and it keeps putting downward pressure on price-setting. Months' supply of new homes has run near eight months in recent Census data, down slightly from a peak but still well above the roughly six months that marks a balanced market. Builders have responded by cutting: the National Association of Home Builders reported in its most recent survey that 43% of builders reduced prices in October, the highest share in its 2020-2026 record. With rates high relative to recent years and inventory comfortable, sellers are being forced into concessions more and more often.
Whether the October peak was the top of this rate cycle is the question that sets the next four to eight weeks. The 30-year rate has now declined in three consecutive weekly prints, and the spread between mortgage rates and longer Treasury yields has room to compress as rate volatility that inflated it through September fades. But an easing of roughly a quarter point from a very high base is not what historically has unlocked purchase demand; the 19%-below-year-ago purchase index makes clear how far the market sits from that trigger. A decline toward the 6.5% neighborhood would start to change the arithmetic, and each Thursday's Primary Mortgage Market Survey is the dated checkpoint for whether the trend continues.
Related reading: New Home Sales September 2026 Fall 5.3% to 676,000 as Supply Stays at 8.4 Months.
Two releases bracket what is next. The NAHB/Wells Fargo Housing Market Index prints November 17 and will show whether builder confidence and those price-cutting plans strengthened into the final weeks of the year, and Census October housing starts follow shortly after for the supply side. For now the honest summary is that rates have turned lower at the margin while affordability is still running roughly 10% worse than a year ago, and purchase demand is not yet responding. That is a market holding its breath, not one where a quarter-point easing changed the math.
Related reading: Mortgage Rates Hold at 7.40 Percent as 30-Year Loans Reshape the Fall Housing Market.
This content is for informational purposes only and does not constitute financial advice. Past performance is not indicative of future results. Consult a qualified financial advisor before making investment decisions.
Get daily intelligence delivered
Create a free account for the Daily Brief every weekday and The Week Ahead every Sunday. No card required.