MBA Mortgage Applications Fall 4.2% as Rates Hit 7.49%


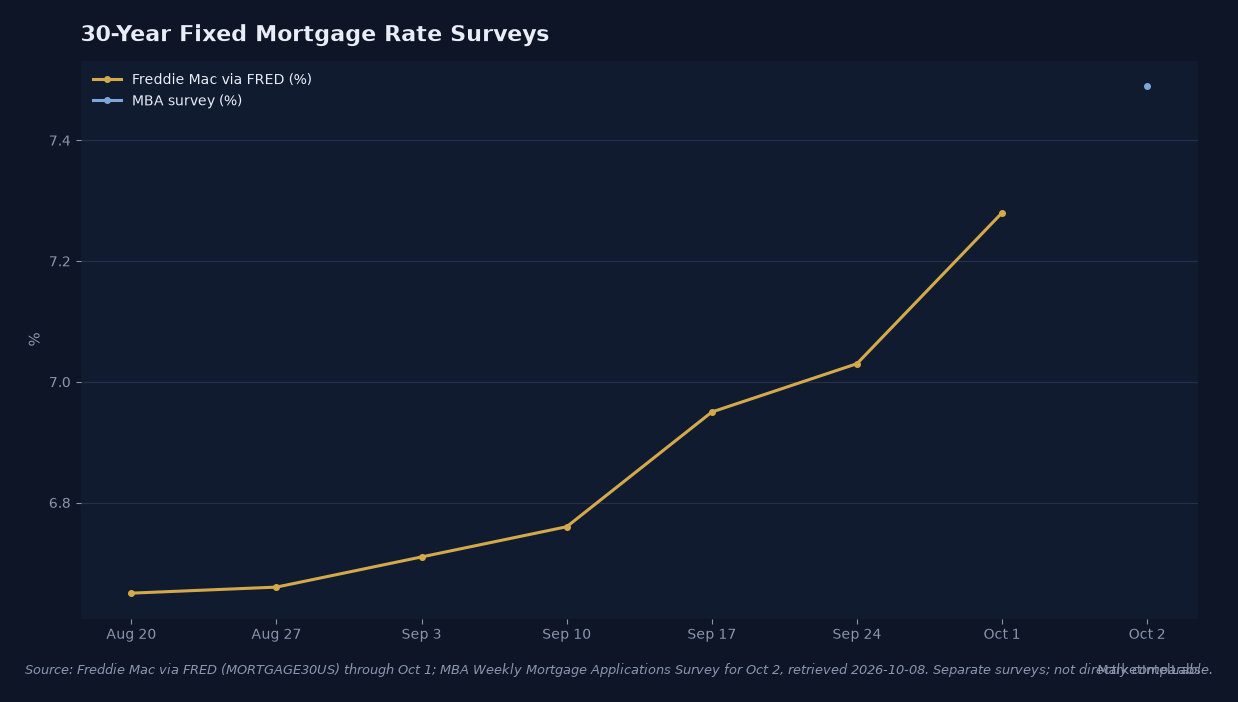
The 30-year mortgage rate jumped to 7.49% in the Mortgage Bankers Association’s survey for the week ending October 2, the highest reading in almost three years, and applications fell 4.2% in one week. Applications declined as financing costs climbed. September data also show more listings and more price reductions, an uneven market rather than a simple freeze.
Related reading: Fannie Mae Mortgage Applications Fall 14.3% as Rates Rise.
The Mortgage Bankers Association’s October 7 release gives a fresher demand reading than the previous week’s Freddie Mac survey. The release shows how quickly financing costs can shift homebuyer calculations. The MBA’s average contract rate on a conforming 30-year fixed loan rose from 7.30% to 7.49% in the week ending October 2. The seasonally adjusted Market Composite Index, its measure of application volume, fell 4.2%; the unadjusted index declined 4%.
The jump followed several weeks of rising readings. Freddie Mac’s weekly average climbed from 6.65% on August 20 to 7.28% on October 1, a 0.63 percentage-point increase. The MBA survey is a separate measure of contract rates, and its October 2 week ended one day after Freddie Mac’s latest print. Different survey methods and timing explain the gap.
Related reading: Mortgage Rates Hit 7.30 Percent and Buyers Are Stepping Away.
Both purchase and refinance applications weakened. Purchase applications fell 2% weekly and 15% year over year. FHA applications fell 6% in the week ending October 2.
The refinance index dropped 8% weekly and 56% year over year, as fewer owners had an incentive to replace existing loans. Adjustable-rate mortgages were 10.3% of applications, unchanged weekly.
Related reading: Freddie Mac's 7.28% Rate Reprices Fall Housing Demand.
A hypothetical $300,000, 30-year fixed loan at 7.49% costs about $2,096 monthly in principal and interest. At Freddie Mac’s 6.34% average on October 2, 2025, it costs about $1,865.
The $231 monthly difference totals roughly $2,770 over a year. Taxes, insurance, and maintenance are excluded. Loan size is held constant.
Related reading: Mortgage Applications Fall 4.1% as Rates Test 7%.
The application count is not a sales count. It reflects mortgage requests during the survey week, and a borrower may apply more than once. It can still reveal when a rate move changes demand before closed-sale data arrive. Recent applications should therefore be read beside contract activity, listings, and pricing rather than as a complete measure of housing transactions.
The 7.49% figure is a survey average, not a quote for every borrower. Conforming-loan points rose to 0.84 from 0.75 in the week ending October 2. Jumbo rates were 7.39%, up from 7.27%; FHA rates were 7.14%, up from 6.97%.
MBA reports rates and points for 80% loan-to-value loans, including origination fees. Credit, down payment, loan size, and lender affect actual offers.
That pricing pressure is already meeting a larger pool of homes for sale, but supply measures differ by data set and update schedule. The distinction matters: listings show choice, while months of supply relates inventory to the pace of completed sales.
The National Association of Realtors reported 4.9 months of supply for existing homes in August, up from 4.6 in July and the highest reading in more than a decade. The measure compares unsold existing-home inventory with the pace of sales, and the September figure is due October 13.
Realtor.com’s September report does not publish a months-of-supply figure, so its active-listing count should not be converted into one using a different sales series. Its report shows listings at 1,161,615, up 5.4% year over year and 9.1% below pre-pandemic levels. Price cuts reached 20.8%, the highest September share since 2018. These measures point to more choice and greater seller flexibility, but elevated financing costs continue to constrain affordability.
The national median masks regional gaps. September 2026 median list prices were $320,000 in the Midwest and $595,000 in the West. Price cuts applied to 20.7% of Midwest listings and 22.8% of Western listings. Affordability varies sharply by location, even at the same national mortgage rate.
Higher borrowing costs coincided with falling applications, lower year-over-year purchase demand, and a higher fixed-payment hurdle. If rates stay near these levels, transactions may remain restrained even as inventory increases. Sellers could compete on price or concessions. Builders may use incentives to protect sales pace.
A single weekly application report is volatile and does not establish a lasting demand trend. September’s larger listing pool and price reductions show adjustment, not a forced-sale cycle. Rates could ease, bringing some waiting buyers back. The next application releases will show whether demand stabilizes as households absorb higher Treasury yields and wider mortgage spreads.
The near-term test is whether financing costs ease and sellers respond to the larger choice of homes. Watch the next MBA application release alongside new inventory and pending-contract data. The rate reading alone cannot settle the question; actual contract activity will show whether buyers are stepping back for a week or for longer.
This content is for informational purposes only and does not constitute financial advice. Past performance is not indicative of future results. Consult a qualified financial advisor before making investment decisions.
Sources: Mortgage Bankers Association, Weekly Mortgage Applications Survey, released October 7, 2026; Freddie Mac 30-Year Fixed Rate Mortgage Average via FRED, series MORTGAGE30US; Realtor.com Economic Research, September 2026 Housing Trends; National Association of Realtors, August 2026 Existing-Home Sales, released September 10, 2026.
Get daily intelligence delivered
Create a free account for the Daily Brief every weekday and The Week Ahead every Sunday. No card required.