Inflation Rate USA Explained: Why 3.7% Is Not Your Rate


What is the inflation rate in the USA? The latest published consumer price index puts it at 3.7% for the 12 months through September 2026, according to the Bureau of Labor Statistics release of October 14. Prices rose 0.6% in September alone after a 0.4% August gain. That is a rate of change, not a forecast for October, and it does not mean the typical family spent exactly 3.7% more. Our day-of account of September CPI and household budgets covers the initial print; this guide explains which numbers belong together and how they feed into the next Fed decision.
The 3.7% is the broad, unadjusted 12-month CPI-U change. The more immediate 0.6% is a seasonally adjusted monthly change. The same BLS report puts the 12-month measure at 3.4% in August and the measure excluding food and energy at 2.6% in September. Read all four figures before inferring a trend. An acceleration in a single gasoline-heavy month says something different from a persistent acceleration across services. The Fed is already weighing that distinction, after raising its policy range in September to 3.75% to 4%.
Related reading: September CPI Explained: August Inflation Was 3.4% Before the October 14 Release.
How the inflation rate got here
BLS data show a jagged path rather than a neat ascent. Seasonally adjusted headline CPI increased 0.9% in March, 0.6% in April and 0.5% in May. It fell 0.4% in June, then rose 0.1% in July, 0.4% in August and 0.6% in September. These are monthly moves, not a series of annual inflation readings. The September release table shows that gasoline registered gains of 21.2%, 5.4% and 7.0% in March through May, fell 9.7% in June, then rose 9.1% in September. Energy has made headline CPI less smooth than a household trying to budget from one grocery receipt to the next.
That history matters because an annual rate can rise when an unusually weak month drops out of the 12-month comparison. The 3.7% September figure compares one basket index level with the level a year before, not twelve times the latest monthly percentage. A sustained run of 0.6% monthly increases would be a serious warning, but one September observation does not establish such a run. June was negative and July was only slightly positive. That is why it is a mistake to multiply September by twelve and announce a new annual inflation rate.
For the broader framework, see our Fed policy coverage.
Related reading: September CPI Inflation at 3.7% As Payrolls Add Just 29K.
At the category level, BLS says gasoline rose 9.1% in September and accounted for more than half the all-items monthly increase. Energy as a group rose 5.2%, after 2.1% in August. The price index for food was unchanged in September: groceries slipped 0.1% while meals away from home gained 0.2%. Shelter moved 0.4% in September, following 0.3% in August. These figures tell us where the latest shock entered, not that every component of the basket behaved the same way.
The year-over-year cuts tell a second story. Energy prices were 20.4% higher than a year earlier, while food was up 2.5%. Shelter was up 3.2% and gasoline 34.2% on the BLS 12-month measures. Core CPI, which removes food and energy, rose 2.6% year over year, up from 2.4% in August. That small core acceleration is the counterweight to a simple account in which energy alone explains all of the pressure. Inflation can broaden even when the most dramatic monthly number comes from the pump.
The Bureau of Economic Analysis August personal income and outlays release offers a related but different lens. Its PCE price index rose 3.4% over the 12 months through August; core PCE rose 3.0%. Its latest release covers August, not September, so those readings cannot be set next to September CPI as though they were simultaneous. Different coverage, weights and index formulas also prevent an apples-to-apples subtraction. The point is not to select whichever inflation rate looks more comfortable. It is to label the month, the index and the population before comparing them.
The mechanism: what CPI measures and what it misses
The BLS explanation of the consumer price index defines CPI as the average change in prices paid by consumers for a representative basket of goods and services. Its CPI-U population covers more than 90% of the US population, but it excludes people in rural nonmetropolitan areas, farm households, military installations and institutions. The average is not a census of each household’s invoices. A renter, a homeowner with a fixed mortgage and someone who must drive long distances can each experience a different cost trajectory.
BLS classifies spending into food and beverages, housing, apparel, transportation, medical care, recreation, education and communication, and other goods and services. The prices of goods and services are combined using spending weights, so a large movement in a small category need not dominate the total. Conversely, a moderate movement in a category that absorbs a large portion of the basket can matter a great deal. September gasoline mattered not just because 9.1% is large, but because BLS explicitly attributes more than half the monthly overall increase to it.
The BLS methodology FAQ is also clear about what is outside the basket. Stocks, bonds and real estate as investments are not day-to-day consumption items. Income and Social Security taxes are excluded, although sales and excise taxes attached to goods can be included. Therefore the CPI rate cannot by itself answer whether a person is better off after taxes, whether a home has become easier to buy, or whether an investment account preserved purchasing power. Those are different calculations with different denominators.
Seasonal adjustment and time windows deserve just as much care. September’s 0.6% monthly headline reading removes recurring seasonal effects; the 3.7% 12-month change uses unadjusted levels. A higher annual number can coexist with a softer monthly number and vice versa because the base period changes. The monthly figure is useful for detecting a fresh turn; the yearly figure smooths more of the seasonal noise. Neither is a perfect measure of what a particular household paid this month.
The wage channel is visible in a separate BLS real earnings release. Average hourly earnings for all employees rose 0.1% in nominal terms from August to September, while seasonally adjusted CPI-U rose 0.6%. Real average hourly earnings fell 0.5% in the BLS calculation. Over the year, real average hourly earnings were down 0.7%, while real average weekly earnings were down 0.1% because the average workweek increased. Paychecks can become larger in dollars without buying more goods.
That does not mean every worker lost 0.5% of purchasing power in September. The published hourly measure is an average across employees, while the price index is a national consumer basket. Hours, household size, taxes and consumption choices vary. Still, the direction of the calculation matters. If nominal pay repeatedly lags price increases, consumer spending can weaken even before nominal income declines. If energy retreats and wage growth holds, the real-pay squeeze can reverse without a pay cut or a recession.
The producer side adds one more possible transmission path, but not a mechanical forecast. In the September producer price index release, final-demand PPI increased 1.3% in a month, versus 0.5% in August, and was 6.3% higher than a year earlier. Final-demand goods were up 2.6%, with energy up 10.8%; final-demand services rose 0.8%. A wholesale cost increase can pass to retail prices, be absorbed in margins, or be offset elsewhere. PPI and CPI have different baskets, so the 1.3% should never be added to the CPI number.
The rate channel runs through expectations as much as through a single published print. Borrowers and lenders price inflation, the expected Fed policy path and compensation for risk into financing costs. Higher energy prices can lift the near-term inflation outlook while tighter borrowing conditions weaken future demand. Both effects may operate at once. Our October Fed decision primer explains why the combination of faster CPI and slower hiring complicates the policy choice rather than dictating it.
The chart: a gasoline swing around a slower core
Our chart plots the seven monthly observations printed in the September BLS CPI table. Each series is the seasonally adjusted monthly percent change. Gasoline uses the same unit but a much wider scale than headline and core CPI, which is why its curve is so steep. The chart is not a projection and it does not turn the monthly core rate into a 12-month rate. It shows how a volatile energy component can push the broad index in one month while underlying components move more gradually.
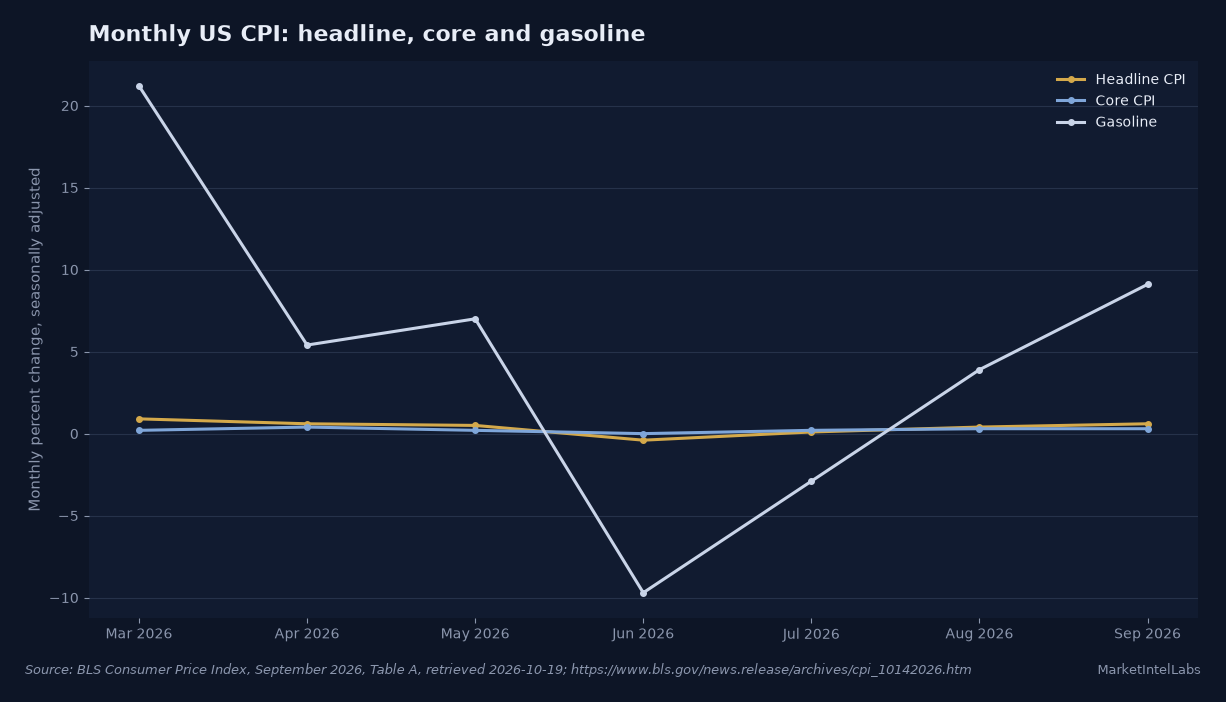
The June-to-September comparison is instructive. Gasoline fell 9.7% in June when headline CPI fell 0.4%, then climbed 9.1% in September when headline CPI rose 0.6%. Core CPI moved from 0.0% in June to 0.3% in September. The parallel motion of headline and gasoline is visible, but it does not prove gasoline was the sole cause. BLS reports the category contribution separately, and the September shelter increase plus the year-over-year core acceleration show why analysts cannot stop with the pump.
The original source table lists 0.9%, 0.6%, 0.5%, negative 0.4%, 0.1%, 0.4% and 0.6% for monthly headline CPI from March through September. Over those same months core reads 0.2%, 0.4%, 0.2%, 0.0%, 0.2%, 0.3% and 0.3%. Gasoline reads 21.2%, 5.4%, 7.0%, negative 9.7%, negative 2.9%, 3.9% and 9.1%. We have not smoothed, annualized or filled any observation. A reader can check every plotted point against the linked BLS release.
What the primary documents actually say
The Federal Reserve statement of September 16 says the FOMC raised the target range by one quarter of a percentage point to 3.75% to 4%, by a 12 to 0 vote. It describes economic activity as expanding at a solid pace, says inflation remains elevated and states the goal of returning inflation to 2%. That statement predates the September CPI report published October 14. It is evidence of the Fed’s framework and last decision, not proof of what it will decide at the October meeting.
The minutes of the September meeting add detail missing from a one-page statement. The manager reported that near-term inflation compensation had risen largely with oil prices, while market- and survey-based longer-term inflation expectations remained stable at levels consistent with the 2% objective. The minutes also report that nominal yields had increased around 35 basis points across the two- to ten-year segment over the intermeeting period. These are observations about that earlier interval, not a fresh yield quote for October 19.
This distinction between expectations at different horizons is central to the analysis. An energy shock that fades can lift the headline rate for a while without permanently changing price-setting behavior. The harder case for the Fed is a shock that feeds into rents, services, wage negotiations and expectations of future inflation. The September core gain of 0.3% is a warning to monitor breadth, but one monthly observation does not establish that expectations have become unanchored. The minutes explicitly distinguish near-term inflation compensation from the longer-term measures.
The PPI release makes the upside risk concrete: final-demand goods jumped 2.6% and final-demand energy 10.8% in September. The BEA release gives the downside to a simplistic demand story: real personal consumption expenditure rose 0.6% in August even as the PCE price index rose 0.3%, and the personal saving rate was 4.1%. Spending was still expanding in that earlier month. Those are not forecasts of what consumers did in September or will do in November, but they show why weak real wages and resilient aggregate consumption can coexist.
There are two plausible readings of the current mix. The softer-inflation case is that a large part of the September headline increase came from gasoline and that a future energy reversal could pull headline CPI down quickly. The stubborn-inflation case is that core also accelerated on the 12-month comparison, shelter rose 0.4% for the month and producer prices increased sharply. Neither case is settled by the phrase “inflation is 3.7%.” The next releases will test which prices keep rising after the energy comparison changes.
Our preference is to separate the identifiable energy shock from the measure of persistence before reaching a policy conclusion. A 0.6% headline month that BLS attributes mostly to gasoline deserves attention, but the two consecutive 0.3% core months deserve their own line in the notebook. A good inflation reading starts with the date and index, then asks what changed within the basket.
What is dated next
The Federal Reserve meeting calendar schedules the next regular FOMC meeting for October 27 to 28. As of October 19, no October decision has been made. The committee can compare the September inflation and employment evidence with other information available before its statement. An unchanged range, an increase or another decision must not be presented as a fact until the Fed announces it. Watch the statement’s treatment of energy, core inflation and employment rather than assuming one CPI headline determines the vote.
BEA schedules its September personal income and outlays release for October 29 at 8:30 a.m. Eastern, according to its August release. That is when the September PCE reading should be compared with September CPI on matching months. The comparison may narrow or widen because their coverage and weighting differ. It is also the place to check whether real consumer spending kept pace with the price increase, not merely whether current-dollar outlays were larger.
The BLS CPI calendar schedules the October 2026 consumer price report for November 10 at 8:30 a.m. Eastern. The real earnings release schedules its October update for the same day and time. A decline in gasoline, a lower core monthly gain and improving real hourly pay would support the temporary-shock reading. Another energy-heavy month accompanied by faster core services and falling real pay would strengthen the persistence case. These are conditions to test, not predictions of either print.
Before those dates, a reader can keep a simple ledger: the index name, reference month, release date, seasonal treatment, monthly change, 12-month change and the category that contributed most. That is more useful than comparing a one-month PPI figure with a 12-month CPI rate or treating a fuel bill as the national average.
Frequently Asked Questions
What is the inflation rate in the USA right now?
The latest available headline CPI-U rate is 3.7% for the 12 months through September 2026, released October 14, according to BLS. The seasonally adjusted monthly September change was 0.6%. That annual rate describes prices through September; it is not an October observation or a personal household rate.
What is the difference between headline and core inflation?
Headline CPI includes food and energy. Core CPI removes both, making it less sensitive to a gasoline swing but also excluding costs households actually pay. In September headline CPI rose 0.6% month over month and 3.7% year over year; core rose 0.3% and 2.6%, respectively, in the BLS release. Use both: headline for the broad price experience and core to test persistence outside food and energy.
Why does my inflation feel higher than the official number?
CPI is a weighted national average for urban consumers, not a household budget audit. The BLS FAQ says people whose spending differs from the average can experience a higher or lower personal rate. A driver exposed to September’s 9.1% gasoline increase may notice a sharper change than someone who rarely purchases fuel. Taxes, investment assets and individual housing financing costs are not all captured by the same CPI measure.
Does a 3.7% inflation rate mean prices will fall soon?
No. A positive 3.7% annual CPI rate means the measured price level was higher than it was twelve months earlier. If the rate falls to a smaller positive number, prices are still increasing on that comparison, just more slowly. A fall in the overall price level requires a negative change in the relevant index over the selected period. Some categories can fall even while the broad basket rises.
When is the next US inflation report?
The next BLS consumer price report, covering October 2026, is scheduled for November 10, 2026, at 8:30 a.m. Eastern, per the official release schedule. BEA’s September PCE report is scheduled for October 29 at 8:30 a.m. Eastern. They are different indexes covering different reference months, so label each report before comparing its headline.
This content is for informational purposes only and does not constitute financial advice. Past performance is not indicative of future results. Consult a qualified financial advisor before making investment decisions.
Get daily intelligence delivered
Create a free account for the Daily Brief every weekday and The Week Ahead every Sunday. No card required.