Gross Domestic Product Q3 Advance Estimate Explained Before the October 29 Release


The gross domestic product q3 advance estimate is the Bureau of Economic Analysis's first calculation of U.S. output for July through September, not a final verdict on the economy. It is scheduled for October 29 at 8:30 a.m. Eastern, together with September personal income and outlays; at this writing the Q3 figure has not been released. Read the annualized real GDP growth rate alongside the contributions from spending, investment and trade, then check real final sales to private domestic purchasers. The first rate tells you how much measured output changed; the second helps show whether domestic private demand did the work. Our Q3 GDP advance preview covers the event's near-term expectations. This feature explains the machinery behind the release, not a result that has yet to arrive. The BEA release calendar gives the date and time.
The word advance matters. BEA starts with an incomplete stack of monthly surveys, administrative records and estimates for missing inputs. An advance reading is the best estimate available on publication day, but BEA can change it as the source agencies report more detail. A strong headline with weak domestic final sales could tell a different story from a similar headline supported by households and fixed investment. Neither combination, by itself, predicts what the Federal Reserve will do. The BEA's GDP definitions and update notes explain both the composition and the sequence of estimates.
Related reading: September CPI Explained: August Inflation Was 3.4% Before the October 14 Release.
How the first GDP estimate became a market event
GDP measures the value added by domestic production. That is not the same as the value of every sale in the country: subtract the intermediate goods and services used to make final products or you would count the same input repeatedly. BEA's expenditure presentation adds personal consumption, gross private domestic investment, net exports and government consumption and investment. The BEA national accounts handbook describes the accounting framework and the source material. A number about domestic production therefore mixes what Americans bought with what firms built, what the government used and what the rest of the world bought from American producers.
The Q2 experience is a useful warning against treating the first release like an audited full-year statement. BEA's July 30 advance release put Q2 real GDP growth at 1.5% at a seasonally adjusted annual rate. The August 26 second estimate also printed 1.5%. The September 30 third estimate moved it to 2.2%, with BEA attributing much of the upgrade to investment, consumer spending and government spending. These are three snapshots of the same quarter, not three successive quarters of acceleration.
For the broader framework, see our Fed policy coverage.
That example is especially instructive because the second estimate appeared stable. At one decimal place the headline did not change, yet underlying information changed. BEA said an upward revision to consumer spending in August was partly offset by an upward revision to imports. A reader who watched only the 1.5% headline missed the change in composition. By September the revision was plain in the headline, too. The sequence says more about incoming source data than about an economy that suddenly accelerated after June.
Annualized growth is another trap. BEA reports the change between adjacent quarters as if that same quarterly pace persisted for four quarters. Its annualization FAQ spells out the compounding calculation: take the ratio of the current to previous quarterly level, raise it to the fourth power, subtract one and express the result as a percentage. The published 2.2% Q2 annual rate was not a statement that output had already grown 2.2% between April and June. It was a standardized pace. Readers comparing it with a year-over-year inflation figure need to keep those different windows straight.
Inflation adjustment changes the question again. Current-dollar GDP values transactions at current prices; real GDP attempts to remove price changes to isolate quantities produced. If nominal output climbs because goods cost more, real output need not rise at the same speed. BEA's definitions distinguish the two series and separately define the purchases price index. With the September PCE report scheduled for the same morning as Q3 GDP, it is tempting to collapse growth and inflation into a single verdict. They answer different questions, and revisions to either input can change the interpretation.
What moves the headline and what moves beneath it
Consumer spending is one part of the GDP identity, but its level and change are not interchangeable. A large sector can contribute to growth even when its own growth rate looks ordinary; a small volatile sector can swing the quarterly change. The contribution tables are a better first stop than a list of component growth rates if the question is why the aggregate printed as it did. BEA links its table 1.5.2 contribution series from the GDP release guide. Compare contributions in percentage points with the headline percentage change, rather than adding raw component growth rates, which use different denominators.
Private inventory investment is measured as a change in stocks held by businesses. GDP can be lifted when firms add inventory faster than before, even if customers are not buying goods at the same pace. Conversely, a slower build can subtract from growth while sales remain firm. That is why the BEA definition of final sales to private domestic purchasers is useful: it strips out changes in inventories, net exports and government spending, leaving consumer spending plus gross private fixed investment. It is a narrower lens on underlying private demand, not a superior replacement for GDP.
Trade can also create a misleading first impression. Imports enter the expenditure accounting with a minus sign because imported goods and services are not domestic production; purchases that include imports were already captured elsewhere in spending. An increase in imports can mechanically lower measured GDP growth even as domestic buyers purchase more. Exports contribute because the goods or services were produced here and sold abroad. BEA's Q2 advance technical notes explicitly discuss higher imports, including capital goods, alongside stronger consumer spending. The sign on an accounting line is not a moral judgment about trade.
Government spending in GDP means government consumption and investment, not every dollar sent to a household. Transfers can influence private spending later, but a benefits payment alone is not a freshly produced service. The NIPA handbook keeps these classifications separate. This matters when a policy announcement is said to add a specified amount to GDP: the budget number and the production flow do not map one for one, and the timing of purchases determines which quarter records the activity.
The transmission to interest rates depends on the combination of growth and prices. Strong private demand can raise expectations that the Fed will have less room to ease if inflation remains above target; weak domestic demand with subdued prices could pull rate expectations the other way. But supply-driven inflation can coincide with weak real activity, producing a much harder policy problem. The Fed's October 28 FOMC statement kept the target range at 3.75% to 4.00%, described domestic spending as resilient and inflation as elevated, and recorded a 10 to 2 vote, with both dissents favoring a higher rate. Our account of that decision covers the vote itself. GDP adds evidence about activity, not an automatic policy instruction.
A hotter GDP number can therefore mean different things for households and markets. A labor-income-led expansion may support consumption and profits; an inventory-led or trade-led surprise may carry less information about durable demand. A bond yield reaction might reflect altered expectations for inflation, policy rates or the amount of compensation investors demand for risk. Inferring which one moved from the GDP headline alone is a reach. The dated composition tables and the simultaneous PCE release offer a better check than a minute-by-minute headline comparison.
The chart: three estimates of one quarter
The comparison below plots two Q2 2026 series across BEA's July, August and September release vintages. Real GDP moved from 1.5% to 1.5% to 2.2% at annual rates. Real final sales to private domestic purchasers moved from 3.9% to 4.2% to 4.6%. Every point comes from the matching advance, second or third BEA release. These are revision vintages for Q2, not a chart of Q3 growth or a timeline of actual output. It shows why a reader needs both the headline and the demand measure, and why neither should be frozen at its first vintage.
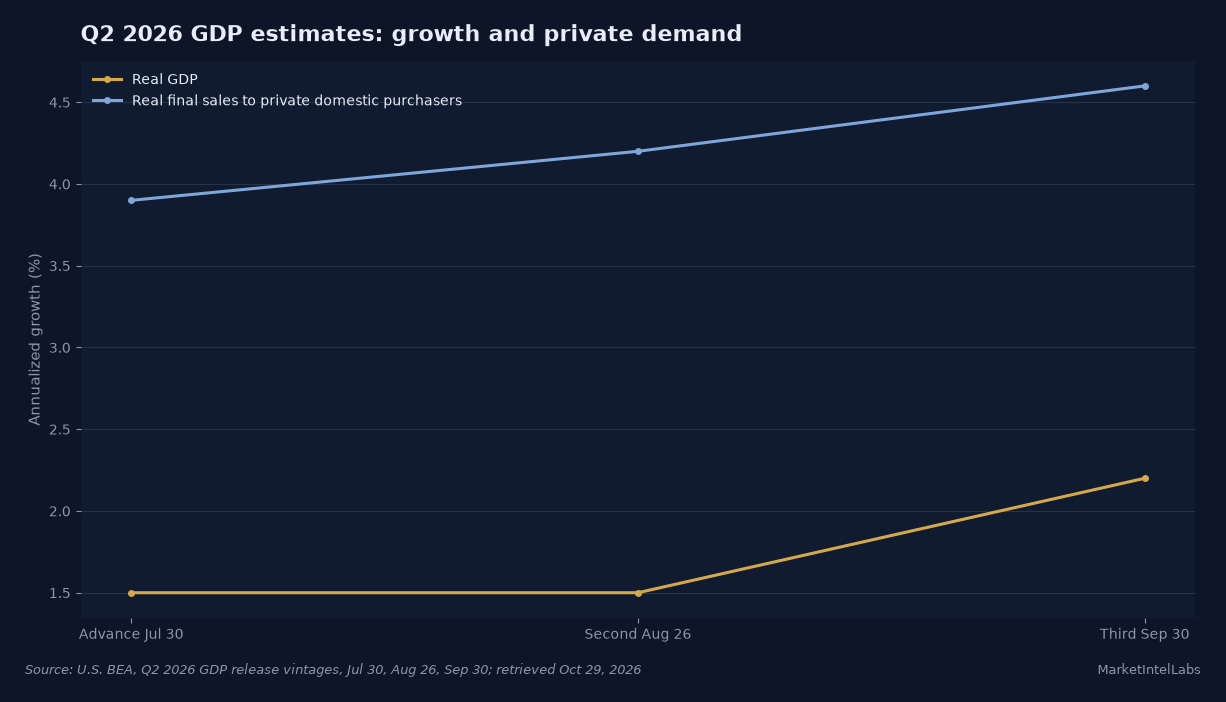
The chart does not establish that every advance estimate will be revised upward. BEA's vintage comparison for 1999 through 2025 puts the average revision without regard to sign at 0.5 percentage point from advance to second and 0.6 from advance to third. The advance-to-latest comparison is 1.3 points, reflecting longer-run annual and benchmark updates as well as later source data. An average absolute revision measures typical magnitude, not a correction you can add to a new headline or a directional forecast.
There is a counterweight to the revision warning. The same BEA comparison says the direction of change in advance and latest real GDP growth estimates matched 97% of the time over its sample. First estimates often get the direction right even when the magnitude shifts. But a small positive reading and a material revision can change how close the economy appears to stagnation. The useful response is neither to discard the first number nor to promote it into a final accounting.
What the source documents actually say
The BEA methods handbook is clear about the challenge: the agency has to convert many source series into a consistent measure of domestic production. Retail trade surveys, construction data, international trade records and services surveys arrive on different schedules. In the Q2 advance technical notes, BEA described some estimates as based on surveys for all three months and others on two months plus a projection. When the missing month arrives, a calculation that was defensible at the time can move. This is a feature of an early release, not evidence that the agency hid a result.
In its Q2 second-estimate notes, BEA traced a services spending revision largely to newly available Census Quarterly Services Survey data. It also identified revised retail data for some goods and newly available energy information for gasoline. The agency did not describe a new economic shock in August affecting Q2; it described a better measurement of activity that had already occurred. That distinction is crucial when someone attributes a revised GDP number to a policy decision made after the quarter ended.
The Q2 third release added another perspective, estimating real gross domestic income growth at 2.6% and an average of GDP and GDI growth at 2.4%. GDP counts output by spending; GDI approaches the same production through income earned and costs incurred. They are conceptually equal but differ in practice because they use largely independent source data, as BEA explains. That disagreement does not identify which measure is wrong in real time. It does show why a single expenditure-side number cannot bear every claim about the cycle.
Some information is absent by design in the advance vintage. BEA says it does not release advance quarterly GDI and corporate profits because inputs for domestic profits and net interest are not available at that point. Its GDP release guide also says industry and state GDP estimates accompany the third estimate. A claim about which industry drove Q3 GDP before those official figures arrive therefore needs a separate, explicitly identified dataset; it should not masquerade as a BEA advance industry breakdown. The missing detail is a limitation of the release, not a license to guess.
Annual revisions make the time stamp on a claim important. BEA's October 2026 revision study says annual updates generally incorporate at least five recent calendar years, while broader benchmark changes arrive roughly every five years. A historical GDP chart downloaded later can differ from what a reader saw on release day. Our chart fixes Q2's three original release vintages precisely to avoid silently replacing the contemporary record with today's revised time series. The BEA revision hub provides comparison tables for components as well as the total.
The Fed's October statement offers a competing emphasis: it calls activity strong and capital investment firm, but also says inflation remains elevated. The two dissenters preferred a quarter-point increase, rather than a hold. That is a genuine disagreement about the policy response, not evidence that GDP by itself has an agreed interest-rate implication. A Q3 print with strong investment and persistent price pressure could reinforce the hawkish case; weaker private final sales could complicate it. Both interpretations must be checked against the actual composition once released.
The BEA calendar places September personal income and outlays on October 29 too. Monthly PCE inflation is not the same series as the quarterly PCE price index embedded in GDP, even though the underlying accounting is related. Our September PCE preview explains why that companion release matters to the policy debate. Read each series with its own frequency and revision status, rather than joining two headlines into a false precision about December.
What comes next, and what would change the reading
At the scheduled October 29 release, start with the real GDP annual rate, then open the contributions and real final sales to private domestic purchasers. If both the headline and private final sales are strong, that is firmer evidence of domestic demand than a headline boosted mostly by inventories or a narrower trade movement. If GDP is weak while private final sales hold up, examine inventories and imports before describing household retrenchment. These are diagnostic questions, not predictions of Q3's actual print; the BEA schedule is the authoritative source for when the facts become available.
BEA currently schedules the Q3 second estimate and corporate profits for November 25 at 8:30 a.m. Eastern and the third estimate, with industries and state detail, for December 23 at the same hour. Dates can change, so consult the live release calendar. The second vintage can revise services and spending data as new source material arrives; the third can sharpen the industry picture. A significant shift in private final sales or a changed balance between spending and inventories would alter the assessment more than a headline revision alone.
One bullish reading would be a Q3 print supported by sustained private purchases and fixed investment, with price measures cooling. One bearish reading would combine weaker final sales with stubborn inflation, making the activity and price signals pull in opposite directions. Neither case is established by the yet-unreleased Q3 estimate. The publication test is simple: identify the vintage, the annualized real growth rate, the domestic final-sales measure and the price evidence before making a claim about policy. If those pieces disagree, the disagreement is the story.
Frequently Asked Questions
What is the gross domestic product q3 advance estimate?
It is BEA's first official estimate of real and current-dollar U.S. production for July through September. It uses incomplete or provisional source data and is followed by second and third estimates as additional records arrive. BEA's GDP release guide explains the vintages and the main accounting measures.
When is the Q3 2026 GDP advance estimate released?
The BEA schedule lists October 29, 2026, at 8:30 a.m. Eastern for the Q3 advance estimate. It also lists September personal income and outlays at that time. At this article's drafting time the figures were pending, so no Q3 growth number is stated here.
Does a 3% annualized GDP reading mean the economy grew 3% in three months?
No. An annualized quarterly reading compounds that quarter's change as though the same pace continued for a year. BEA's annualization explanation gives the formula and an example. Read it as a comparable pace, not the actual cumulative change over the three-month quarter.
Why does BEA revise advance GDP estimates?
The first estimate uses source data that are incomplete or still subject to revision. Later releases add surveys and records that were not ready for the first deadline. BEA's revision comparison reports an average 0.6 percentage-point absolute change from advance to third real GDP growth estimates for 1999 through 2025. That is historical context, not a correction factor for a particular print.
What is the difference between GDP and final sales to private domestic purchasers?
GDP covers all domestic output across consumer spending, investment, trade and government activity. Real final sales to private domestic purchasers narrows the focus to consumer spending and gross private fixed investment, excluding inventory changes, net exports and government spending. BEA defines both. Comparing them can help show whether private domestic demand supports the headline, but neither measure replaces the other.
This content is for informational purposes only and does not constitute financial advice. Past performance is not indicative of future results. Consult a qualified financial advisor before making investment decisions.
Get daily intelligence delivered
Create a free account for the Daily Brief every weekday and The Week Ahead every Sunday. No card required.