Gold and Silver Sell-Off: Technical Breakdown and Fed Implications

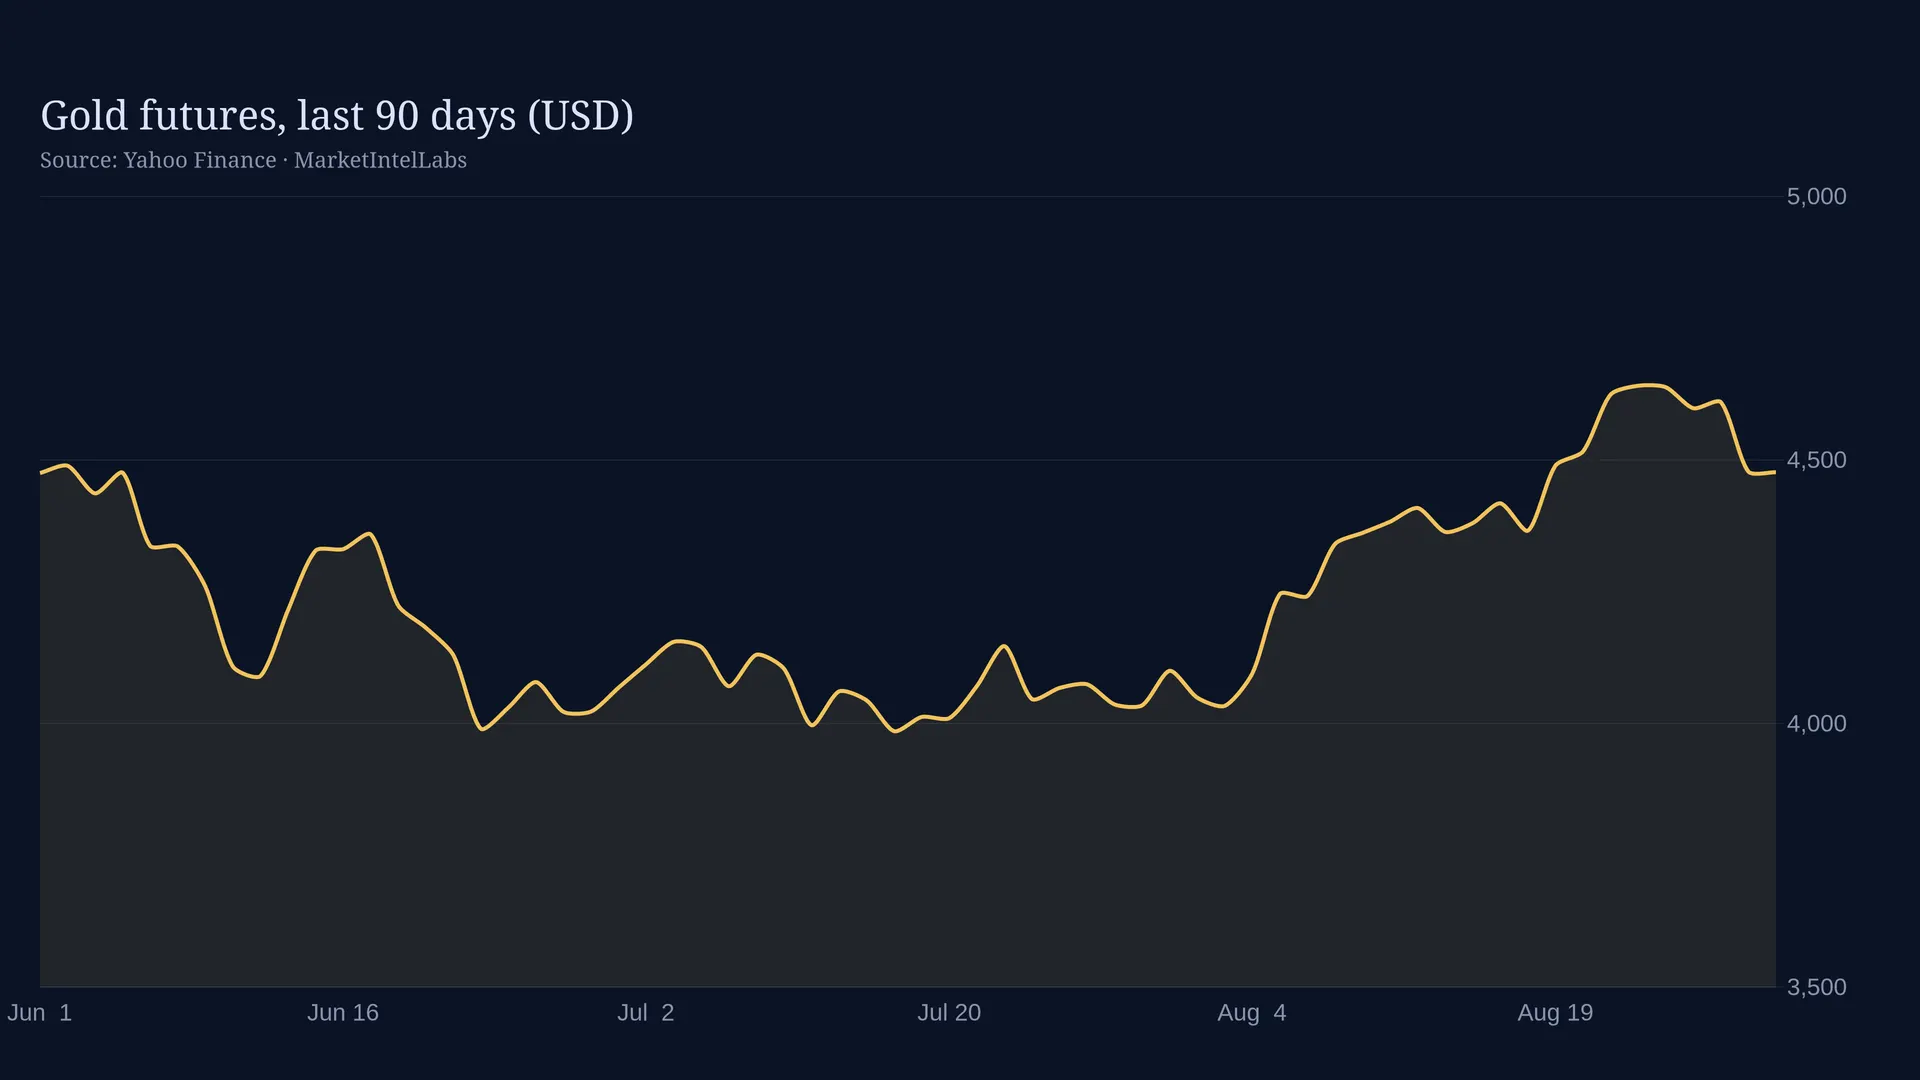
Gold and silver sold off sharply today despite a weaker dollar. Gold dropped 3.24% while silver fell 4.38%. The dollar index declined 0.16% week-over-week to 118.06. This divergence points to technical exhaustion after a strong August rally rather than a macro-driven move.
Key Takeaways Gold fell 3.24% and silver 4.38% on August 31 despite a 0.16% drop in the trade-weighted dollar index. The 10-year yield held at 4.67% while the 2-year yield edged to 4.20%, keeping the spread positive at 47bps. CPI rose 0.07% month-over-month and PCE increased 0.16%, both consistent with the Fed's "last mile" plateau. The unemployment rate ticked down to 4.1% in July from 4.2%, supporting the Fed's patient st…
Keep reading with a free account
Get tomorrow's institutional market briefing before markets open, produced by specialized AI analysts researching markets 24/7. Takes under a minute, no card required.
- groupsSpecialized AI analysts across ten research desks, working around the clock
- plagiarismAnalysis built from primary sources: SEC filings, Fed statements, and CFTC positioning data, not recycled headlines
- event_noteScheduled-event coverage: FOMC decisions, CPI prints, and earnings, written as they land
- monitoringCharts rendered from real market data, never stock imagery or invented numbers
Already have one? Log in · Want everything the day it publishes? Go Premium
Secure checkout via Stripe