case shiller Home Price Index: August Prices Up 2.1% Nationwide, But Still Falling in Real Terms


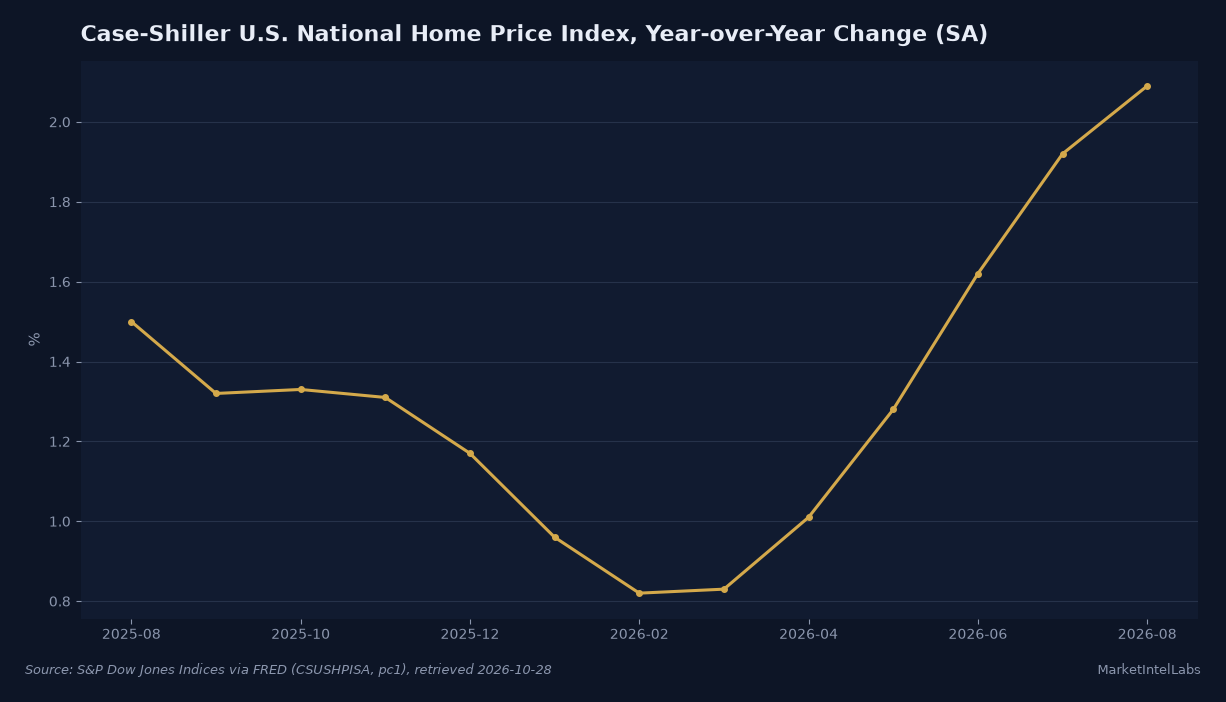
U.S. home prices kept climbing in August, but only in nominal terms. The S&P Cotality Case-Shiller U.S. National Home Price Index rose 2.1 percent from a year earlier, up from a 1.9 percent gain in July. Because consumer prices ran at 3.4 percent over the same stretch, the average home actually lost value in real terms for the 15th consecutive month.
The gap is the story. S&P Dow Jones Indices put August inflation roughly 1.3 percentage points above the home price gain, the same arithmetic that has quietly eroded affordability all year even as headline prices set records. Rebecca Kaufman, associate director of commodities at S&P Dow Jones Indices, put it plainly: prices declined in real terms for a 15th straight month, though the gap narrowed as nominal growth strengthened.
Related reading: Home Prices Are Outpacing a 7% Mortgage Rate, and That Math Cannot Hold.
The two city composites point the same way. The 10-City Composite rose 3.6 percent year over year, up from 3.4 percent in July, and the 20-City Composite gained 2.7 percent, up from 2.5 percent. On a month-over-month basis the seasonally adjusted national index ticked up 0.3 percent, and the 10-City version rose 0.4 percent. The non-seasonally adjusted numbers fell 0.2 and 0.4 percent respectively, a divergence S&P attributed to the typical post-summer slowdown hiding some underlying strength.
Related reading: case shiller Home Price Index: July Up 2.47%, August Due.
Regional divergence widened into the post-summer months. Chicago led all 20 covered metros for a sixth straight month with a 6.7 percent annual gain, followed by New York at 6.2 percent and Cleveland at 4.3 percent. Out west, Seattle recorded the largest annual decline for a third consecutive month at minus 2.0 percent, with Las Vegas down 1.3 percent and Denver off 0.8 percent. That left a gap of nearly nine percentage points between the strongest and weakest markets, one of the widest spreads S&P has recorded in this cycle.
There is a data caveat worth flagging. Cotality, the data provider behind the index, continues to see transaction delays from the recording office in Wayne County, the most populous county in the Detroit metro area. Those delays hit the August transaction data, so S&P published no valid August update for Detroit; a valid July reading was still included. That is a data-quality note, not a market signal.
Related reading: New Home Sales September 2026 Fall 5.3% to 676,000 as Supply Stays at 8.4 Months.
Affordability math still grinds against buyers. On a median-priced new home of $393,300, the July reading from Census data on FRED, a 30-year fixed mortgage at the current 7.32 percent rate from Freddie Mac's Oct 22 survey works out to about $2,161 a month in principal and interest with a 20 percent down payment. A year ago, with the same loan and the 6.19 percent rate of late October 2025, that payment was roughly $1,925. The difference is about $236 a month, a 12 percent jump driven almost entirely by higher rates rather than a higher price on this particular home.
The rate backdrop has been the constraint all fall. Mortgage rates held near 7.40 percent for two weeks in October before easing to 7.32 percent, and that level still prices out a large share of first-time buyers. S&P itself flagged the pressure, noting that with inflation at 3.4 percent, Brent crude near $100 a barrel and mortgage rates in the mid-to-high sixes, households face elevated costs alongside persistently high home prices. For the housing market, the August print is a fresh confirmation of a dynamic that has defined 2026: nominal appreciation continues, but it no longer keeps pace with the cost of carrying a mortgage.
Sellers have noticed. Earlier this month, price cuts reached a four-year high as sellers offered concessions to move inventory in a market where supply has climbed to about 8.5 months by the latest measure, versus 8.4 months a year earlier. More months of supply means more negotiating room for buyers, which is part of why nominal price growth has cooled from the double-digit pace of 2024 even as the metro leaders keep grinding higher.
What to watch next. The next Case-Shiller release, covering September data, is scheduled for November 24. The more telling question is whether the nominal rate of appreciation can stay ahead of inflation as we head into winter, when seasonal weakness typically shows up in the non-adjusted numbers. If the wide real-versus-nominal gap persists, the affordability squeeze deepens regardless of what the headline index prints.
The bottom is not in for the national affordability problem. Nominal prices are up, real values are down, and the gap between Chicago and Seattle shows that the market tightness is no longer a national story but a regional one. That is the read from the August Case-Shiller data: a market that has stopped beating inflation, one metro at a time.
This content is for informational purposes only and does not constitute financial advice. Past performance is not indicative of future results. Consult a qualified financial advisor before making investment decisions.
Get daily intelligence delivered
Create a free account for the Daily Brief every weekday and The Week Ahead every Sunday. No card required.