case shiller Home Price Index: July Up 2.47%, August Due


The Case-Shiller Home Price Index measures changes in the resale prices of the same single-family homes, not the average price of houses sold this month. Its latest available 20-City Composite, for July 2026, rose 2.47% from a year earlier but edged down 0.01% from June before seasonal adjustment, according to S&P Dow Jones Indices’ September 29 release. The August reading is scheduled for Tuesday, October 27 at 9 a.m. Eastern, or 13:00 UTC. It has not yet been released at the time of this writing; any claim about its direction would be a forecast, not a result.
The practical conclusion is less cheerful than the positive annual number sounds. Prices can rise more slowly while financing grows more expensive. Freddie Mac’s October 22 mortgage survey put the average 30-year fixed rate at 7.32%, versus 6.19% a year earlier. On a hypothetical 20% down payment against the September median existing-home sale price, the principal-and-interest payment is roughly $276 a month higher than with the year-earlier median and rate. That is a national illustration, not an offer to any particular borrower.
The key distinction for the release later today is between an index of repeat transactions and an affordability measure. Case-Shiller can tell you how a matched-home price basket changed. It cannot tell you whether a first-time buyer can find a suitable house in the right neighborhood at an affordable monthly payment. Our housing-week look at rates and purchasing power addresses the payment side; this feature explains what the price series measures and how to read the next observation.
How we got to the July reading
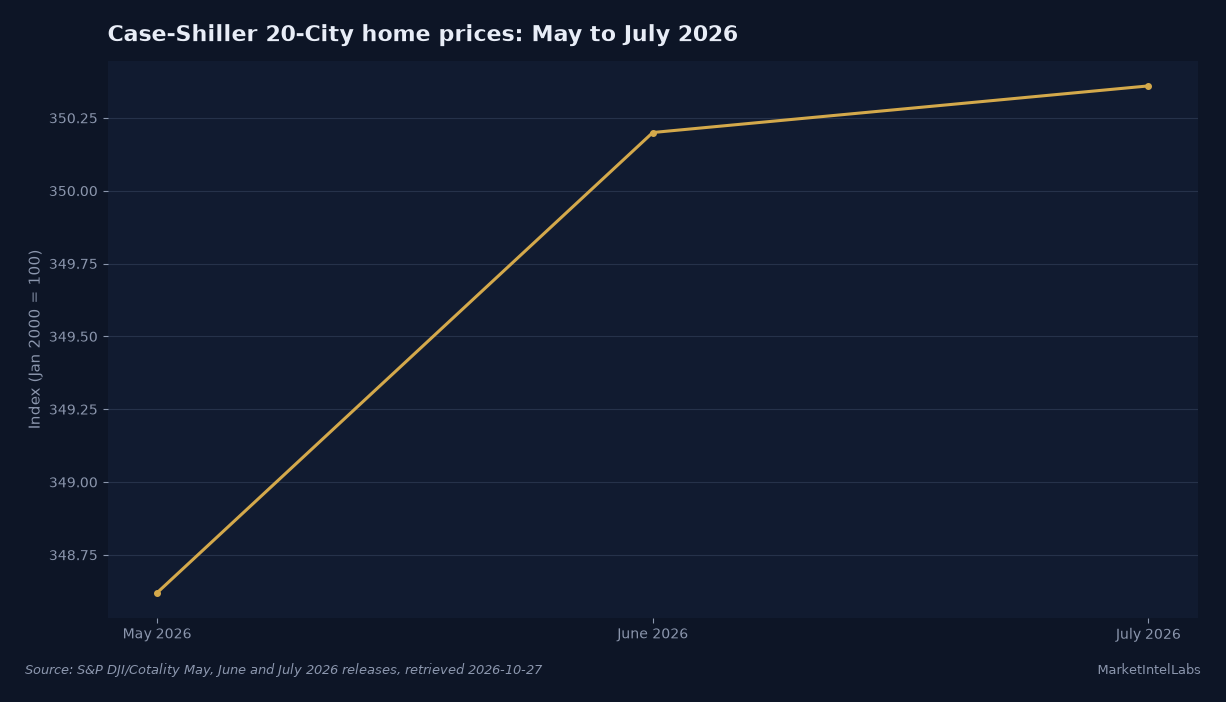
The published 20-City Composite index was 348.62 for May, according to the July 28 S&P release. In the following August 25 release, the June level was 350.20, with a 2.10% annual rise shown in its table. The September 29 table then listed July at 350.36 and the July annual change at 2.47%. These are vintages of the same series, not three separately surveyed sets of sale prices. S&P says it may revise the previous 24 months when more transactions arrive. The comparison is useful for direction, not an immutable record of each historical monthly percentage.
July’s national index, which covers nine census divisions, was 337.31 and gained 1.93% over 12 months. The 10-City Composite was 373.86, up 3.39%. Those are three different baskets. Readers who see a national gain of 1.9% beside a 20-City gain of 2.5% should not average them or treat the difference as a data error. S&P describes the 20-City measure as a composite of its metro indices, while the national measure combines the census divisions. A headline about the 20-City series cannot stand in for every American home.
The history inside this short run also needs care. The July release reports the 20-City Composite’s July-to-June move at minus 0.01% on the unadjusted series. Its seasonally adjusted move is plus 0.32%. July generally brings a different pattern of transactions from winter. Seasonal adjustment tries to remove that recurring pattern, so a negative unadjusted month and a positive adjusted month can coexist. Neither tells us the price of an individual home, and the seasonal factors themselves can be revised.
A 2.47% annual rise sounds like inflation for anyone looking at a listing. But S&P’s same release says the national index gained 1.9% over the year while consumer prices rose 3.4% in July. The national home-price series therefore fell in inflation-adjusted terms by the release’s comparison. An owner’s nominal home value may have risen while the purchasing power of that gain declined. The CPI comparison is national to national; it should not be applied mechanically to a particular 20-City metro.
The markets underneath the composite are doing different things. S&P’s July table puts Chicago at plus 6.86% year over year and New York at plus 5.78%. Seattle was minus 1.57%, Las Vegas minus 1.29%, and Denver minus 1.09%. That spread is bigger than the composite’s gain. Chicago’s strength is not evidence that a Seattle seller gained 2.47%, and Seattle’s decline does not invalidate the national result.
How repeat sales become an index
The publisher says its Case-Shiller indices combine matched price pairs from thousands of arm’s-length sales of individual houses. If the same qualifying property sells twice, the change between those transactions contributes to a price-change estimate. Comparing a house with itself helps avoid mistaking a shift in the mix of homes sold for a price move. A median sales price has no such guarantee: an unusually large share of expensive homes can push the median higher even if comparable houses did not appreciate.
That design brings limits. Properties need usable sale pairs, so the index cannot include every listing or every unclosed contract. A particular home may have been renovated between sales, and the underlying records arrive with a lag. The July S&P release specifically withheld a valid Detroit July update because of delayed records from Wayne County; it supplied a June update instead. This is a reminder to read the release notes before filling an empty cell with an estimate. Missing is missing, not zero.
Case-Shiller is also late by construction. The date in “July index” describes the housing period, while September 29 is the publication date. For a reader searching for a same-day October home-price verdict, July is the last verified index month as this piece is drafted. The August index is due at 13:00 UTC today. Fresh asking prices, signed contracts and weekly mortgage quotes answer different questions and are not substitutes for that unpublished reading.
The base of 100 in January 2000 gives the index a scale, not a dollar price. A July level of 350.36 means the index stands roughly 3.5 times its January 2000 base under the publisher’s construction; it does not mean the median home costs $350,360 or that a buyer in every metro has seen precisely the same appreciation. Index levels are most useful when compared with their own earlier levels and the same adjustment convention.
Consider the federal government’s alternative. The FHFA September 2026 House Price Index release says its seasonally adjusted nationwide index rose 0.3% from June to July and 2.6% from July 2025. FHFA and Case-Shiller cover different underlying transactions and publish different geographic aggregations. The apparent gap between FHFA’s 2.6% national annual gain and Case-Shiller’s 1.9% national gain is a measurement difference to investigate, not proof that one agency recorded a wrong price. Even within FHFA, the July annual changes ranged from plus 0.6% in the Mountain division to plus 6.3% in the Middle Atlantic.
A second comparison comes from actual sales prices. The National Association of Realtors’ September existing-home report gives a $417,500 median price and a 1.3% annual increase. This is a different month from the July Case-Shiller observation, and a median of homes sold is a different statistic from repeat-home appreciation. Treating 1.3% as an update to the Case-Shiller 2.47% is an apples-to-oranges claim. It is, however, a relevant check on the amount a household is actually paying at closing.
The chart and the payment mechanism
Our chart plots the levels reported in three consecutive S&P releases, rather than inventing an August point. May was 348.62, June 350.20 and July 350.36. The final step is nearly flat, although the annual index was still positive. A short sequence cannot establish a lasting trend, especially when S&P can revise the observations. It does show why an annual gain and a weak latest unadjusted month are not contradictory.
The index matters to household budgets through both purchase price and financing. A slower price increase can ease the down-payment hurdle relative to a faster increase; a higher mortgage rate can more than offset that relief in the monthly bill. The rate is not in the Case-Shiller calculation. That separation is why a softer index print would not automatically mean a cheaper mortgage, and why a modest price gain can coexist with a deteriorating payment calculation.
For a transparent example, use NAR’s $417,500 September median sale price and Freddie Mac’s 7.32% October 22 average 30-year fixed rate. At 20% down, the illustrative loan balance is $334,000. Amortizing it over 360 monthly payments produces about $2,294 in monthly principal and interest. Using NAR’s $412,300 year-earlier September median and Freddie Mac’s 6.19% rate from a year earlier produces a $329,840 illustrative loan and about $2,018 in principal and interest. The difference is about $276, even though the median sale price rose only 1.3%.
Those calculations assume identical 20% down payments, 30-year terms and no fees or points. They exclude property tax, insurance, maintenance, closing costs and any lender-specific pricing. The median homes in the two periods are not necessarily comparable. Nor did an actual borrower necessarily receive the national weekly average. The exercise isolates the rate-and-price arithmetic; it does not estimate an individual’s qualification or full cost of ownership.
Supply is the other half of the mechanism. NAR estimated 4.8 months of existing-home inventory at September’s sales pace, compared with 4.5 months a year earlier. More months of supply can restrain a seller’s ability to raise prices, but the ratio moves with the pace of sales as well as the number of listings. Our report on home price cuts and seller concessions is useful background on how negotiating behavior can change before a broad repeat-sales index captures it.
New homes offer another, separate window. The Census Bureau and HUD August new-home sales report estimated 8.5 months of supply and a $393,700 median sales price for newly built houses. Its reported 5.8% annual median-price decline came with a published 90% uncertainty range of plus or minus 8.2 percentage points; that interval includes zero. New homes are not the same population as Case-Shiller’s repeat sales, and a new-home median can shift with builders’ product mix. It would be a mistake to call the new-home median a confirmed annual fall in existing-home values.
What the primary records disagree about
One interpretation of the July S&P release is that a 2.47% annual 20-City gain, following 2.10% in the June release, points to continued nominal resilience. That view has support in Chicago and New York, and in FHFA’s positive national print. It also relies on a slow-moving measure. A household that already owns a house might regard a positive nominal index as stabilization rather than a fresh boom.
The counterargument is about current demand and purchasing power. The same S&P release records a nearly flat unadjusted July 20-City month, Seattle below its year-earlier level and a national gain below consumer inflation. NAR’s September pending-home-sales release reports signed contracts down 7.3% from August and 11.3% from a year earlier. Pending sales track contracts, not repeat-sale prices; they are a warning about the transaction pipeline, not a numerical forecast for the next Case-Shiller observation.
The apparent conflict between stronger annual appreciation and weaker contracts is what we would expect when buyers react faster than measured resale prices. A seller can hold an asking price while a buyer steps back from a 7.32% mortgage. Fewer agreements appear in contract data immediately; only completed eligible repeat sales eventually enter the price index. Price concessions may happen without an immediate index-level decline. That is an analytical mechanism, not a claim that one month of contracts predicts a specific August price reading.
The source documents themselves warn against false precision. S&P can revise 24 months of Case-Shiller observations and explicitly identified a missing Detroit update. Census marks the August new-home annual median-price move as statistically uncertain. NAR’s existing-home report is based on closings and notes that it does not capture all transactions outside its listing-system data. FHFA’s seasonally adjusted index is not interchangeable with S&P’s unadjusted headline. A credible cross-check keeps those labels attached to the numbers.
There is also a geographic error to avoid. The July divergence between Chicago and Seattle is an observed fact, but it cannot by itself tell us that all Midwestern properties are tight or every West Coast neighborhood is soft. FHFA’s census-division data also show a broad split, but division boundaries are not metro boundaries. A buyer or seller needs local comparable sales, available inventory and financing terms; the broad indices tell a market story, not a property appraisal.
What comes next
Today’s dated test is the August Case-Shiller release, scheduled for 9 a.m. Eastern according to S&P’s publication convention and this week’s release calendar. Read the 20-City year-over-year change against July’s 2.47%, the unadjusted monthly change against July’s decline of 0.01%, and the adjusted monthly change against July’s plus 0.32%. Then inspect the metro table and any note about Detroit or other delayed records. If the prior July index is revised, use the newly published vintage when calculating the monthly comparison.
Watch whether the next 20-City annual rate falls while monthly adjusted prices also soften. That combination would make the cooling interpretation stronger. A firmer adjusted monthly reading across many cities would argue against drawing a broad conclusion from one nearly flat unadjusted July observation. Neither scenario should be written as fact before the release. The article needs an update when S&P publishes the August table, not a guessed value at 10 a.m.
Census also scheduled its September new-home-sales report for October 27, according to its previous release. That report is about contracts for new construction and can help describe demand and builder inventory; it will not replace the August repeat-sales result. The next Freddie Mac weekly mortgage observation comes on its Thursday publication cycle. Each series has a date and a different unit. The best housing read will reconcile them without forcing them to tell the same story.
For readers tracking affordability, our analysis of September pending contracts supplies the demand backdrop. The question to carry through the next four to eight weeks is whether more inventory and weaker signed contracts reach completed repeat sales while borrowing costs remain high. The decisive evidence will be the revised monthly index path and the mortgage-payment math, not a single headline about home values.
Frequently Asked Questions
What is the Case-Shiller Home Price Index?
It is a set of indices published by S&P Dow Jones Indices and Cotality that use matched sale prices for the same qualifying single-family houses to estimate changes in home values. The 20-City Composite aggregates selected metro indices; it is not a list-price index or a dollar median. The publisher’s release explains the matched-pair construction and index base.
When is the August 2026 Case-Shiller release?
The August observation is scheduled for Tuesday, October 27, 2026 at 9 a.m. Eastern, or 13:00 UTC. At the time of drafting, the last verified 20-City reading is July’s 350.36 index level and 2.47% annual gain. An August figure should not be inferred from September home sales or October mortgage quotes.
Why can Case-Shiller prices rise while home sales fall?
The index measures changes in matched completed transactions, while a sales report counts transactions over a different window. High borrowing costs may first reduce contract signings; qualifying completed repeat sales enter the price series later. NAR’s September pending-sales report shows a contract decline, not a Case-Shiller price forecast.
Is Case-Shiller seasonally adjusted?
S&P publishes both forms. Its headline composite historically uses nonseasonally adjusted values, while the release includes adjusted data for analysis. July’s 20-City monthly change was a decline of 0.01% unadjusted and plus 0.32% adjusted. Compare like with like across months rather than choosing whichever sign suits a narrative.
Does a higher Case-Shiller index mean a home is affordable?
No. Affordability also depends on mortgage rates, income, down payment, taxes and insurance. An illustrative 80% loan on NAR’s $417,500 September median at Freddie Mac’s 7.32% weekly average implies about $2,294 a month in principal and interest alone. A specific borrower’s costs can differ substantially.
This content is for informational purposes only and does not constitute financial advice. Past performance is not indicative of future results. Consult a qualified financial advisor before making investment decisions.
Get daily intelligence delivered
Create a free account for the Daily Brief every weekday and The Week Ahead every Sunday. No card required.