Housing Week: Mortgage Rate Eases to 7.32% but Buyers Lose 11% Purchasing Power

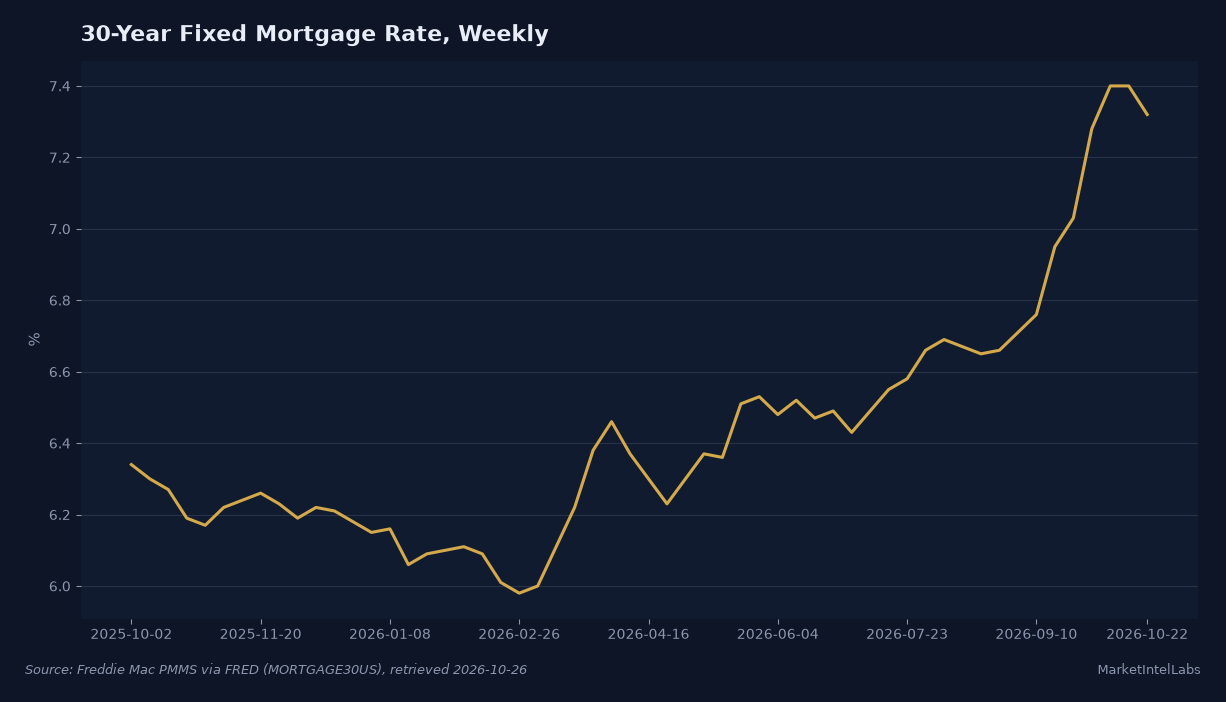
The 30-year fixed mortgage rate averaged 7.32% for the week ending October 22, Freddie Mac's Primary Mortgage Market Survey shows. That is a modest step back from the 7.40% the survey printed for two straight weeks, the highest reading in over a year. It is still 1.13 percentage points above the 6.19% of a year ago, and that gap is the whole story of the housing market right now.
Run the affordability math and the friction is easy to see. At 7.32% on a median-priced home around $411,000, with 20% down, the monthly principal and interest payment is roughly $2,257. The same home cost about $2,010 a month at last October's 6.19% rate. That is about $247 more per month, or 12% higher, before taxes and insurance enter the picture.
Related reading: Mortgage Rates Hold at 7.40 Percent as 30-Year Loans Reshape the Fall Housing Market.
Supply, for its part, is loosening at the margins even though volume is flat. New single-family starts ran at a 1.221 million annual rate in September, down from 1.288 million in August and about 7% below a year ago, per the Census Bureau. Permits were essentially flat at 1.400 million and roughly 3% below last September. The builder who wants to put shovels in the ground is still pulling permits; the slowdown is in the pace, not the intentions.
Listed inventory keeps building, and the figure now tells the tone rather than the volume. Active listings reached about 1.16 million in September, up 5.4% from a year earlier, and new homes for sale sat at an 8.5-month supply in August. A market balanced between buyers and sellers typically carries about six months of supply, so 8.5 means the house on the for-sale list is no longer the scarce object. The scarce object is the buyer who can absorb a 7.32% payment.
Related reading: Housing Inventory Climbs 6.7% as Sellers Cut Prices.
Regionally, the national counts still hide the usual split. The Sun Belt carries the bulk of the new-inventory build because builders went there first, while the Northeast and parts of the Midwest stay thinner. The two regions move at a different pace, but both have hit the same wall this autumn: a monthly payment roughly 12% larger than it was a year ago.
The demand side is the flat line. New home sales ran at a 684,000 annualized rate in August, up 6.4% from July but about 2% below a year earlier, and the median new home price was $393,700. Case-Shiller's national index rose 1.9% year over year through July, a pace that mostly tracks construction costs rather than bidding pressure. Book it as steady: more inventory, roughly flat transactions, prices holding rather than rising.
Related reading: Mortgage Rates Reach 7.40% as Housing Completions Fall.
Stretch the same monthly budget across the rate move and the purchasing-power loss comes into focus. The monthly payment that financed a $328,560 principal at 6.19% last October carries only about $292,000 in principal at 7.32%, roughly 11% less home for the same money. That compression is the mechanism under the flat sales line: demand has not vanished, it has been priced down by the rate.
Watch the builders' response as the tell. With months of supply rising and rates high, the pressure lands on incentives rather than stickers. Rate buydowns, closing-cost help and smaller floorplans are how builders hold traffic at a 7.3% mortgage, and the application data through the winter will show whether those tools are pulling buyers in or just holding the line. A builder who starts cutting list prices outright is the signal that the rate is finally winning.
Related reading: Freddie Mac's 7.28% Rate Reprices Fall Housing Demand.
The variable doing the rationing is the rate, not the supply. A buyer who could carry the payment on a $411,000 home at last October's 6.19% rate needs roughly 12% more monthly cash today just to keep up, so the market clears by financing less or buying smaller. That is why the weekly rate number matters more this cycle than the monthly starts print does.
The next hard print is Tuesday, October 27, when the Census Bureau and HUD release September new-home sales. October housing starts follow on November 18, and the NAHB housing market index returns in mid-November. Between now and then, Freddie Mac's Thursday mortgage survey is the number to watch, because everything downstream of it, from applications to permits, lags the payment.
If the 30-year holds above 7% through the winter, expect the current pattern to persist: builders answer with incentives and smaller homes rather than outright price cuts, and transactions grind sideways into the spring. The February and March purchase-season prints will decide whether demand can absorb payments near $2,250 a month or whether a softer labor market forces this market to clear lower. Watch the weekly Freddie Mac survey and the October starts report as the leading indicators, but the real decision point is spring, when affordability either clears or pushes sellers down.
This content is for informational purposes only and does not constitute financial advice. Past performance is not indicative of future results. Consult a qualified financial advisor before making investment decisions.
Get daily intelligence delivered
Create a free account for the Daily Brief every weekday and The Week Ahead every Sunday. No card required.