LA-Long Beach Cargo Record Signals a Front-Loaded Peak Season as Container Rates Climb

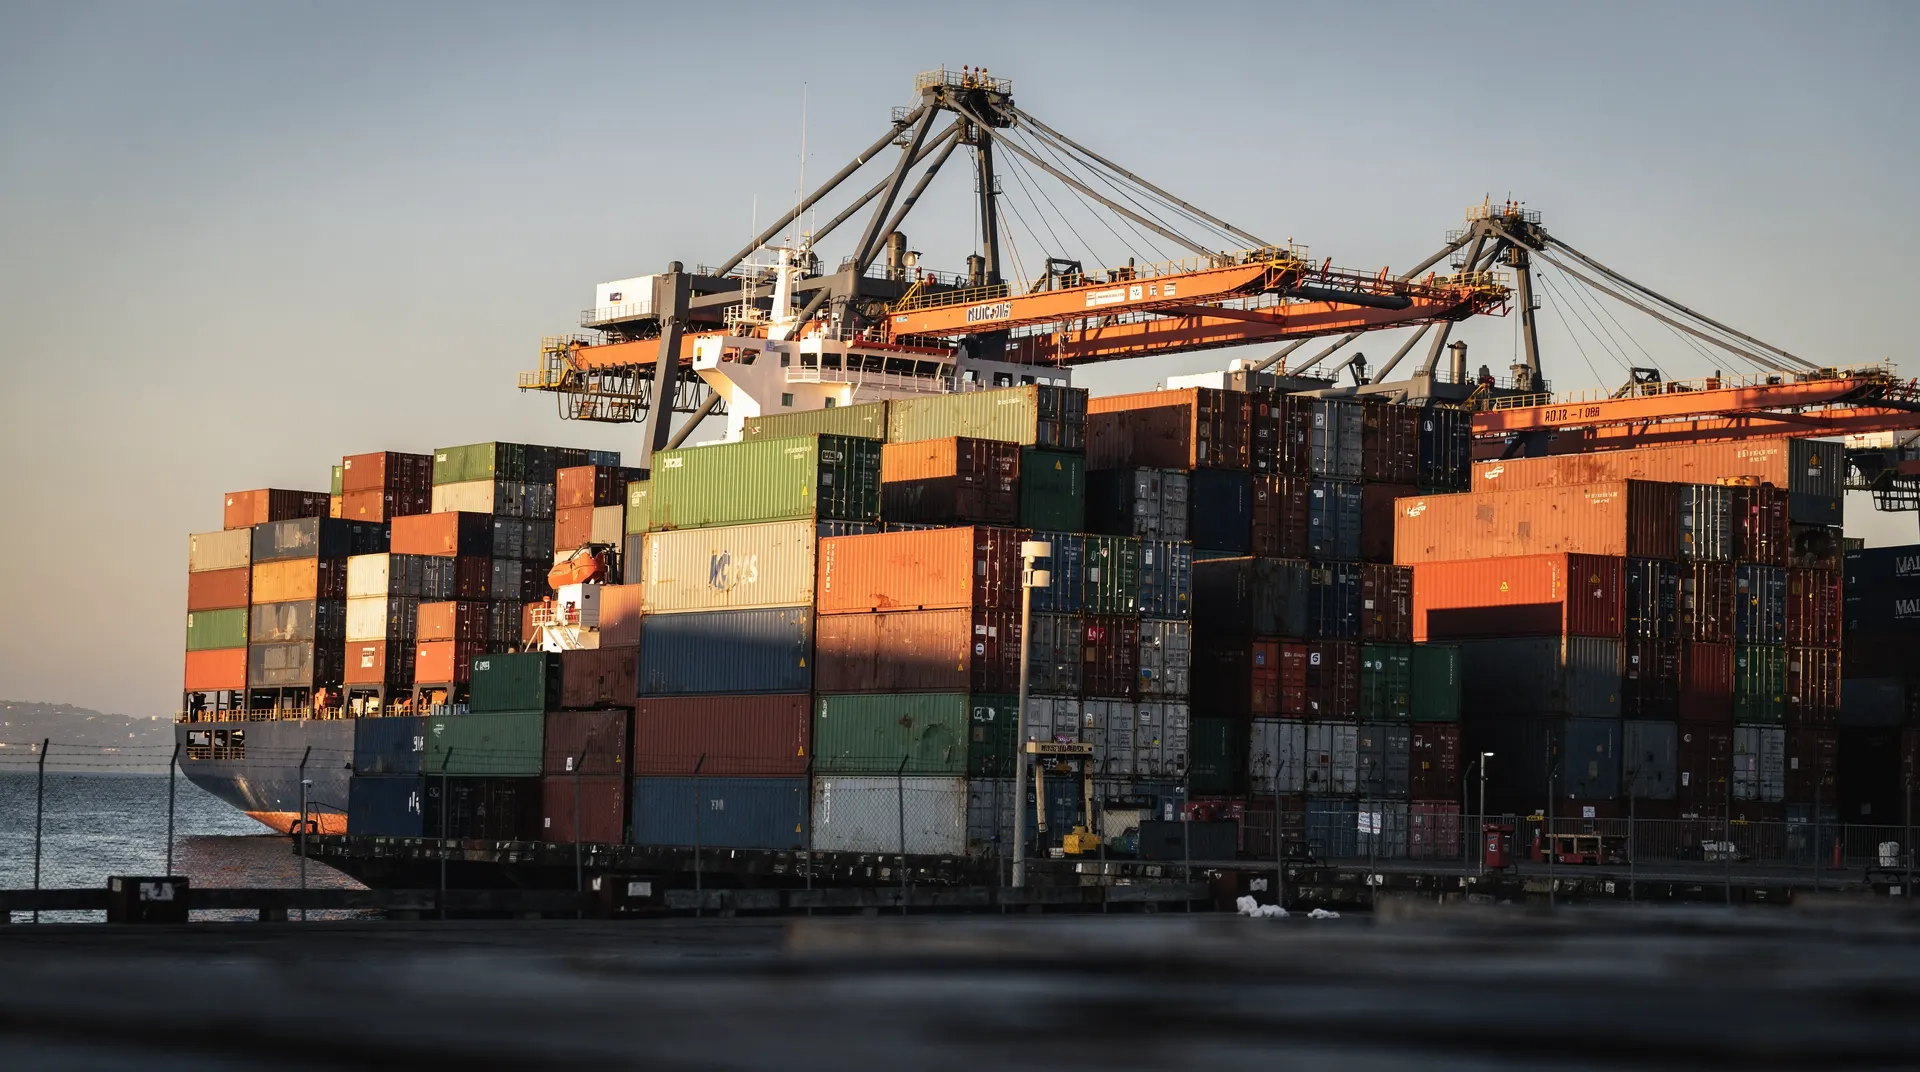
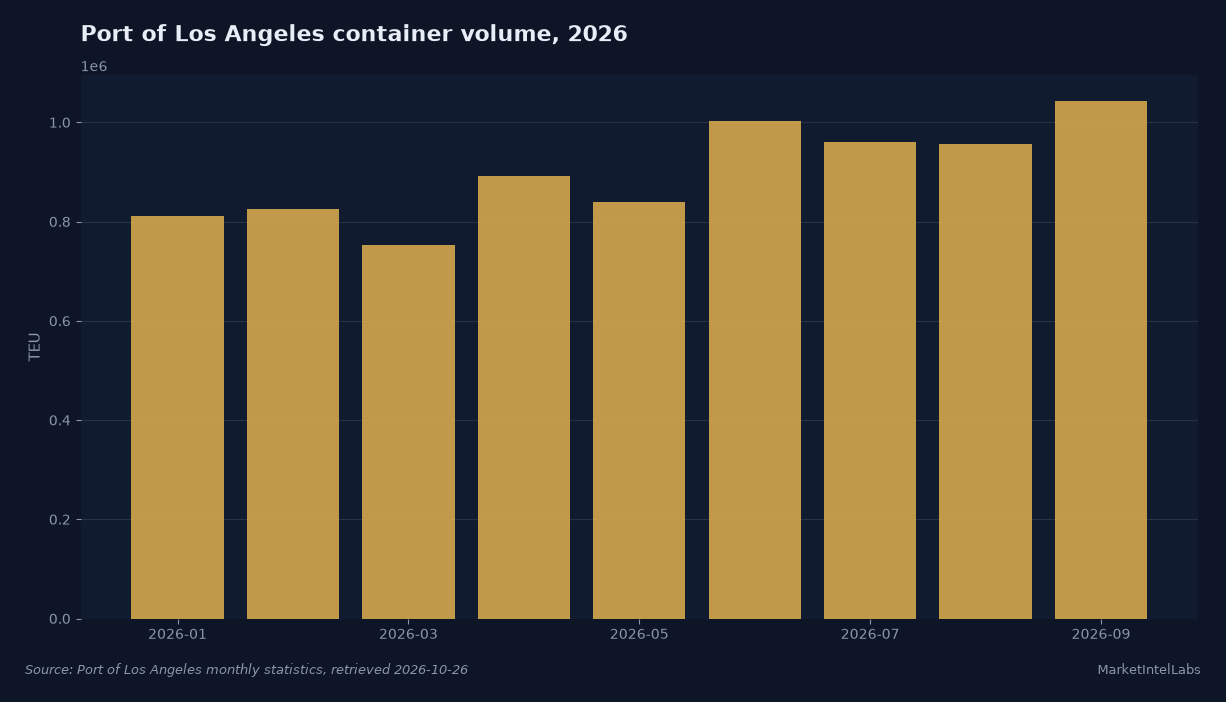
The San Pedro Bay port complex ended September with the busiest month in its history, and the freight market is still catching its breath. Los Angeles and Long Beach together moved roughly 2.04 million TEU in September, up 21.4 percent from a year earlier. Los Angeles reported 1,042,652 TEU, up 18.1 percent year over year, its best single month in 118 years of operation, while Long Beach posted a port record of its own. It is the clearest signal yet that peak season arrived early and landed hard on the West Coast.
The September print came with loaded imports doing the heavy lifting. Los Angeles handled 545,696 loaded import TEU, up 19 percent year over year, while empty container repositioning hit 371,206 TEU, the highest ever recorded at the port. Port executives attributed the surge to importers ordering earlier than usual for the holiday season, a deliberate effort to pull cargo forward ahead of tariff deadlines and the Lunar New Year production shutdown in Asia early next year.
Related reading: September Set to Be 2026's Busiest Month at US Ports.
The pull shows up in rates and in the physical queue. On October 22 the world composite index compiled by Drewry stood at $4,585 per forty-foot container, up 2 percent week over week and the highest level in 15 weeks, with the transpacific Shanghai-Los Angeles leg close to $8,007 per FEU. Spot rates have now climbed for two consecutive weeks, and carriers have been tightening capacity: cancellations across the major east-west routes fell to about 8 percent of scheduled sailings for the coming weeks, with only two blank sailings announced for the transpacific in the week ahead.
The congestion is the part that costs importers money. Terminal dwell and vessel wait times have built through the month as gate volumes ran far ahead of the seasonal norm, and carriers trimmed their empty-sailing schedules to keep capacity tight. For importers that booked early to beat the rush, the strategy partly worked: they secured rate and space before the peak, but they are paying for chassis, drayage and storage at the margins as containers sit longer under the record flow.
Related reading: Diesel Prices Near $6.18, Up 69% Year Over Year: What Freight Costs Next.
The survey side agrees. The U.S. composite flash Purchasing Managers' Index for October, released October 23, showed the manufacturing output index at 56.0, the strongest in more than four years, explicitly lifted by a pickup in new export orders. The detail that matters is the survey's supplier delivery times index deteriorated to its weakest reading since 2022, meaning vendors were taking longer to deliver. That is the direct statistical echo of the record port month: more import volume means longer lead times, and lead times feed straight into inventory planning and freight pricing.
Freight rates are not the only cost rising. On-highway diesel averaged $6.276 a gallon in the week of October 19, according to the Energy Information Administration, up from $6.179 the prior week and roughly 69 percent higher than a year ago. Diesel is the fuel that moves the cargo once it leaves the dock, so every truck move out of Los Angeles carries a bigger fuel surcharge than it did a quarter ago, adding to the all-in delivered cost even before the ocean freight leg is counted.
Related reading: Transpacific Container Rates Near Annual High at $7,884.
This week is largely a trade-policy and rate-calendar story from here. The spread between the world composite and the Shanghai-Los Angeles leg is worth watching, because it captures how much of the recent increase is demand-pull on the transpacific versus rate leadership from other legs. If the spread keeps widening, the West Coast pull is accelerating; if it narrows, part of the composite move is ships being redeployed away from Asia-Europe toward the transpacific, which would eventually cool rates.
The bear case deserves airing. A record September often means a thinner January, and importers are not shy about saying some of this cargo was simply moved earlier in the calendar. If October and November hold near current levels, the peak has been genuinely pulled forward and the first-quarter lull will be deeper. And diesel at $6.28, if it keeps climbing, eventually becomes a demand destroyer rather than a pass-through cost: at some point the delivered price of a container starts to compress order volumes rather than just invoices.
Related reading: Transpacific Spot Rates Climb as Carriers Pull Capacity.
None of that changes what the September numbers say about the current cycle. West Coast imports are running at a record rate, the freight market is tightening in response, and the supply chain is working through volumes it has simply never handled in a single month before. For retailers and manufacturers planning the next two quarters, the message is a familiar one from peak seasons past: book space early, lock in rates when you can, and expect the harbor to stay crowded into the new year. The open question is whether importers keep pulling cargo forward through October and November, or whether the surge we are watching was the front of the wave, not the whole thing.
This content is for informational purposes only and does not constitute financial advice. Past performance is not indicative of future results. Consult a qualified financial advisor before making investment decisions.
Get daily intelligence delivered
Create a free account for the Daily Brief every weekday and The Week Ahead every Sunday. No card required.