Consumer purchases offer a tangible view of the spending behind September’s PCE inflation report. Illustration: MarketIntelLabs
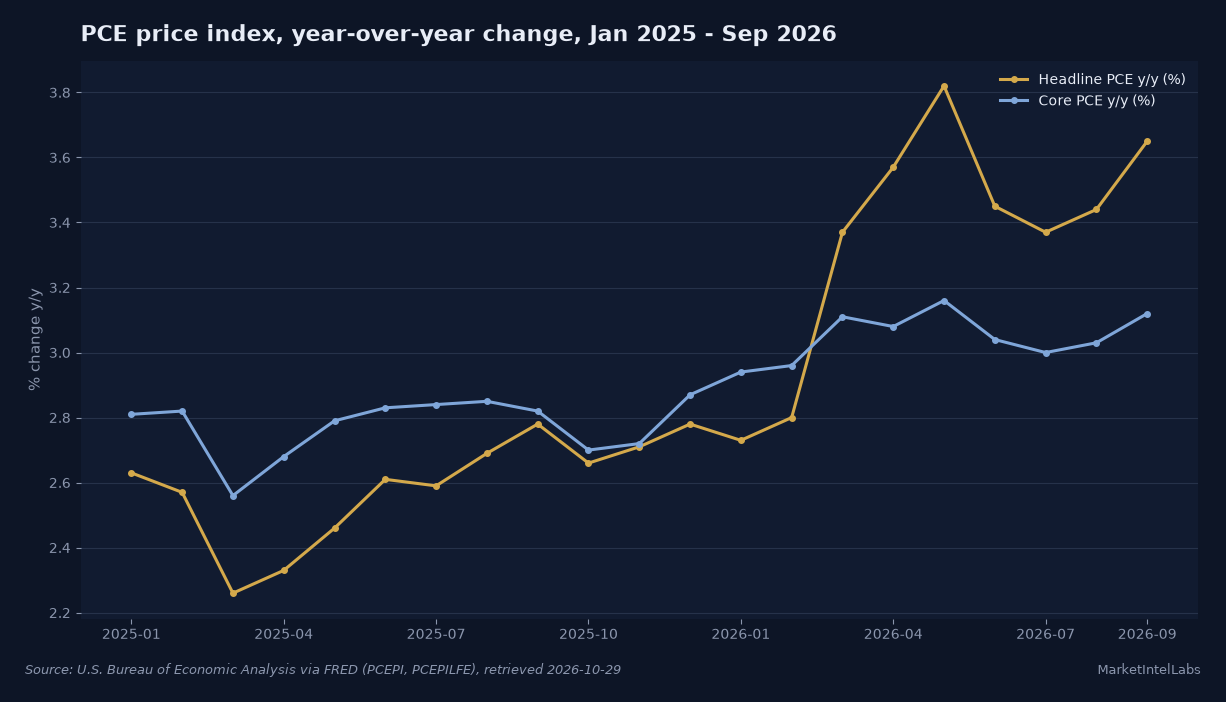
Personal consumption expenditures came in right at the edge that matters. The core PCE price index rose 0.3 percent in September on the rounded figure the BEA publishes, matching the 0.3 percent consensus, but the unrounded index moved up 0.32 percent, a touch above the 0.30 percent line this desk flagged as the number that would reopen the December FOMC question. Headline PCE rose 0.5 percent in September, in line with expectations, and the year-over-year rate printed at 3.6 percent, one tenth below the 3.7 percent consensus.
The delta was the annual headline, not the monthly core
On the monthly rates this release was close to a non-event. Headline PCE at plus 0.5 percent matched the WSJ survey median, and core at plus 0.3 percent matched its consensus as well. The genuine delta was the annual headline figure: at 3.6 percent it printed one tenth below the 3.7 percent analysts had penciled in.
That modest miss is still the harder number for the Fed. Both annual rates accelerated from August. Headline PCE was 3.4 percent in August and 3.6 percent in September; core was 3.0 percent and is now 3.1 percent. The pace of disinflation is not making fast progress on the Fed's preferred gauge. The September report ticks the annual numbers up, not down, and that is the fact a tightening-inclined committee will read most closely.
One caution applies to a decimal the BEA does not print. On the rounded basis the core m/m rate was 0.3 percent, a benign read. But the underlying index rose about 0.32 percent in September, per the BEA's index values via FRED, which sits just above the 0.30 percent threshold this desk flagged as the line that could reopen the December question. In plain terms the monthly core rate sits right at the line, not clearly on either side of it.
Elsewhere the release moved with the price index. Personal income increased $54.5 billion, or 0.2 percent at a monthly rate, in September; disposable personal income rose $52.7 billion, also 0.2 percent; and current-dollar personal consumption expenditures increased $113.1 billion, or 0.5 percent. The increase in current-dollar income primarily reflected gains in compensation and government social benefits, the BEA said. That current-dollar PCE split into an increase of $35.1 billion in spending on goods and $78.1 billion on services.
Real PCE, which strips out prices, increased just $2.6 billion, or less than 0.1 percent, underscoring that the gap between the nominal and real readings is now almost entirely price. The personal saving rate held at 3.8 percent. The current-dollar figures were revised in prior months as part of the standard annual update, so the month-to-month changes should be read against the BEA's revised Table 2.1, not older prints.
The first market response, and what it confirms
Markets read the release as mildly benign, with the cooler-than-consensus annual headline doing most of the work. In mid-session trading the S&P 500 tracking fund SPY was quoted near $768.18, up about 0.6 percent; the tech-heavy QQQ rose near 1.3 percent to $713.59; and the small-cap IWM gained about 2.6 percent to $283.94, leading the tape. That risk-on leadership is the tell: investors treated the one tenth of relief in the annual print as a reason to add risk, and did not view the core m/m rate as hot enough to force an aggressive repricing.
The rate complex moved less. The 10-year Treasury yield was near 4.98 percent, easing modestly off the 5 percent line it tested into Wednesday's Fed hold. Long-duration TLT was essentially flat, down about 0.2 percent at $81.57, and intermediate IEF was roughly unchanged near $91.31. The dollar firmed a touch, with the DXY near 102.10. Gold was flat near the $4,000-plus level, with GLD around $369.37. None of this is a decisive move; it is an initial, muted reaction to a print that matched on the monthly rates and came in just cool on the annual headline.
This release lands inside a chain this desk has tracked all week. The FOMC held its target range at 3.75 percent to 4.00 percent on October 28 with a tightening bias, per our reaction coverage, and rate-odds markets kept the probability of a December 25-basis-point hike near 81 percent this morning. Today's print does not break that thesis; it muddies the calendar. A core m/m rate right at the 0.30 percent line, unrounded and slightly above it, is precisely the ambivalent signal that keeps the December move live without making it a lock. The annual headline coming in a tenth cool gives the doves ammunition; the annual rates still accelerating gives the hawks theirs. This is the two-sided setup our preview flagged, and it resolves neither direction today.
The housing and consumer desks feed the same picture. Mortgage applications rebounded 3.4 percent this week as the 30-year rate slipped to 7.37 percent, per our housing coverage, and producer prices have been running ahead of CPI, a margin that eventually shows up in the PCE pipeline. A real-PCE gain of less than 0.1 percent is the soft part of the picture, and it is the detail a market up on this print may be too quick to skip.
What to watch next
The next decision point is the December FOMC meeting, and the data between now and then decides whether the tightening bias becomes a hike. Before that, markets get the October and November PCE reports, with the next Personal Income and Outlays release on November 25. The employment report and the next CPI print will shape the path as well. For the December debate specifically, watch whether core m/m resolves clearly above or below the 0.30 percent line, and whether the annual core figure, now 3.1 percent, keeps heading toward the 3 percent handle or starts climbing again. If core annual inflation tracks upward into December, the 81 percent December odds likely underprice a move; if it resumes its drift down, those odds have room to fade. The balanced read today is that the Fed's preferred gauge is neither clearly disinflating nor clearly re-accelerating, which leaves the December question genuinely open.
This content is for informational purposes only and does not constitute financial advice. Past performance is not indicative of future results. Consult a qualified financial advisor before making investment decisions.