Meta earnings: How a $130B to $145B capex plan tests cash flow

Meta earnings for the third quarter of 2026 have not been released as of this Wednesday morning. The company says it will publish results after the October 21 market close and discuss them at 4:30 p.m. Eastern. The useful question before that event is whether advertising cash generation can keep pace with a much larger artificial intelligence infrastructure program. Meta's latest published outlook calls for $130 billion to $145 billion of 2026 capital expenditures, including principal payments on finance leases, versus $72.22 billion in 2025. Those are company forecasts and historical figures, not a new third-quarter result, according to its earnings announcement and second-quarter release.
This explainer examines the available numbers, not a prediction of a print that has yet to arrive. Our same-day Meta and Tesla earnings preview sets out the near-term event calendar. Here, the issue is how to read Meta's spending, cash and advertising disclosures together rather than treating a large capex headline as an automatic verdict on AI returns. A bigger spending guide would change the cash-flow arithmetic immediately; it would not, on its own, establish whether the future servers earn an adequate return.
The distinction reaches beyond Meta to the equipment and construction firms serving it. Meta is an advertising platform that buys chips, network gear and data-center capacity. Its purchases are potential revenue for suppliers, but a purchaser's budget is not a supplier's booked sales, let alone its profit. For Meta shareholders, the same budget is a claim on cash that might otherwise be retained or returned. Which side wins depends on the timing of investment and the performance of the core ads business.
How Meta arrived at a larger spending plan
Start with the base year. Meta's full-year 2025 results reported $200.97 billion of revenue, $72.22 billion of capital expenditures including principal on finance leases, $115.80 billion of operating cash flow and $43.59 billion of free cash flow. In that January release, management projected 2026 capex of $115 billion to $135 billion. The planned expansion was already large before the first 2026 quarterly report.
The first-quarter 2026 release raised that forecast to $125 billion to $145 billion. Management explicitly pointed to higher component pricing and investment to support its AI efforts and core business. The same release reported $56.31 billion of revenue, $19.84 billion of capital expenditures including lease principal, $32.23 billion of operating cash flow and $12.39 billion of free cash flow. Revenue was up 33% from a year earlier, according to Meta, while both ad impressions and price per ad increased.
By the June-quarter report, the outlook narrowed to $130 billion to $145 billion. Meta reported $60.80 billion of revenue, up 28% from a year earlier, alongside $31.08 billion of capital expenditures including lease principal. Operating cash flow was $31.86 billion; free cash flow was only $784 million. The ad business was still growing: Meta reported 28% year-over-year revenue growth in the quarter. It was a quarter in which cash spent on investment absorbed almost all the cash generated by operations under Meta's reconciliation.
The quarterly operating margin deserves a separate line of sight. Meta reported 31% in the June 2026 quarter against 43% a year earlier. Its $42.03 billion of quarterly costs and expenses included $2.40 billion of charges related to legal proceedings and $1.18 billion of severance linked to its May headcount reduction. A reader who attributes the entire margin decline to AI equipment would overstate the case. Conversely, removing those unusual expenses does not erase the cash paid for infrastructure. Expense recognition and cash spending follow different schedules.
For a year-earlier comparison, the third-quarter 2025 report showed $51.24 billion of revenue, $19.37 billion of capital expenditures including lease principal, and $10.62 billion of free cash flow. Those figures describe the prior-year quarter, not the result due tonight. They show the scale of the spending step Meta must fund if it maintains the 2026 forecast.
Notice that the annual guide and any single quarterly run rate answer different questions. The annual figure is management's expected total over the calendar year, subject to construction schedules and the arrival of equipment. A quarterly cash outflow can jump when a facility or server shipment is paid for without giving an investor a clean measure of the ultimate earning capacity of that asset. The October report should be read for changes to the annual range and for management's explanation of the timing behind them.
How the earnings and cash-flow mechanism works
Meta makes most of its money from advertising delivered through its apps. The commercial loop is straightforward: a business pays for an impression or conversion opportunity, Meta serves and prices the ad, and cash collected from advertisers finances staff, computing capacity and shareholder distributions. AI enters the loop twice. Recommendation and targeting systems may improve engagement or ad value today; model training and inference require costly capacity before all possible future products have revenue attached.
Meta disclosed that second-quarter 2026 ad impressions increased 14% from a year earlier and average price per ad increased 12%. Those two changes help explain its 28% reported revenue growth, although currency and mix complicate any attempt to multiply the two percentages into an exact income statement. The company also reported 3.60 billion family daily active people on average in June, up 3% from a year earlier. A huge user base is a distribution advantage, but it is not a return-on-capital calculation.
The spending enters the accounts on more than one clock. A company buying servers and building data centers generally reports investment cash outflows when it pays suppliers. Depreciation then spreads the accounting cost of eligible assets over their useful lives. Operating cash flow starts with business cash generation and adjusts for noncash accounting charges and changes in working capital. Free cash flow, as defined and reconciled by Meta, subtracts investment outflows from operating cash. Finance leases can change the comparison because principal payments are included in Meta's capex figure; readers should use the company's stated definitions rather than subtracting every disclosed figure mechanically.
That is why EPS alone is a poor gauge of this spending cycle. A server purchase can put immediate pressure on cash while its expense appears through depreciation over later periods. A rising depreciation bill can also reduce reported operating income even after the construction payment is behind the company. Watch both the cash-flow statement and management's discussion of useful lives, expected capacity and running costs. They tell different parts of the same story.
The margin test is equally practical. If better ad targeting lifts the value advertisers pay for impressions, revenue can expand even with little change in user growth. If equipment pricing or demand for compute rises faster than ad monetization, operating costs and future depreciation can eat into the gain. Meta's second-quarter figures show both sides at once: 28% revenue growth alongside a narrower operating margin, with litigation and severance also affecting the comparison. A single quarterly margin is not a clean measure of AI profitability.
For the wider technology sector, the spending guide is a demand signal, not a purchase order allocated among vendors. Semiconductor producers, networking suppliers, power equipment firms, data-center landlords and construction contractors occupy different places in the supply chain. A shift toward leased capacity can also alter who recognizes an asset and when. The financing discussion around AI infrastructure offers useful background on why capital structure matters, while our analysis of AI concentration in the S&P 500 explains why a single large buyer's expectations can influence an entire index.
It is tempting to compare Meta's $130 billion to $145 billion plan directly with Alphabet or Microsoft's AI budgets. Do not do that without aligning the period and the accounting measure. Meta's guide is for calendar 2026 and expressly includes principal payments on finance leases. Another company may report fiscal-year investment, property and equipment purchases, or spending including a different lease treatment. The broad sector demand is real as a matter of company disclosures, but a precise ranking of budgets requires like-for-like documents, not mixed headline numbers.
What the original quarterly chart shows
Our chart plots four Meta quarters using the capital expenditure and free-cash-flow figures in its Q3 2025, Q4 2025, Q1 2026 and Q2 2026 releases. It does not extend the line into an unpublished third quarter. Capex including lease principal was $19.37 billion, $22.14 billion, $19.84 billion and $31.08 billion in those quarters. Reported non-GAAP free cash flow was $10.62 billion, $14.08 billion, $12.39 billion and $0.784 billion, respectively.
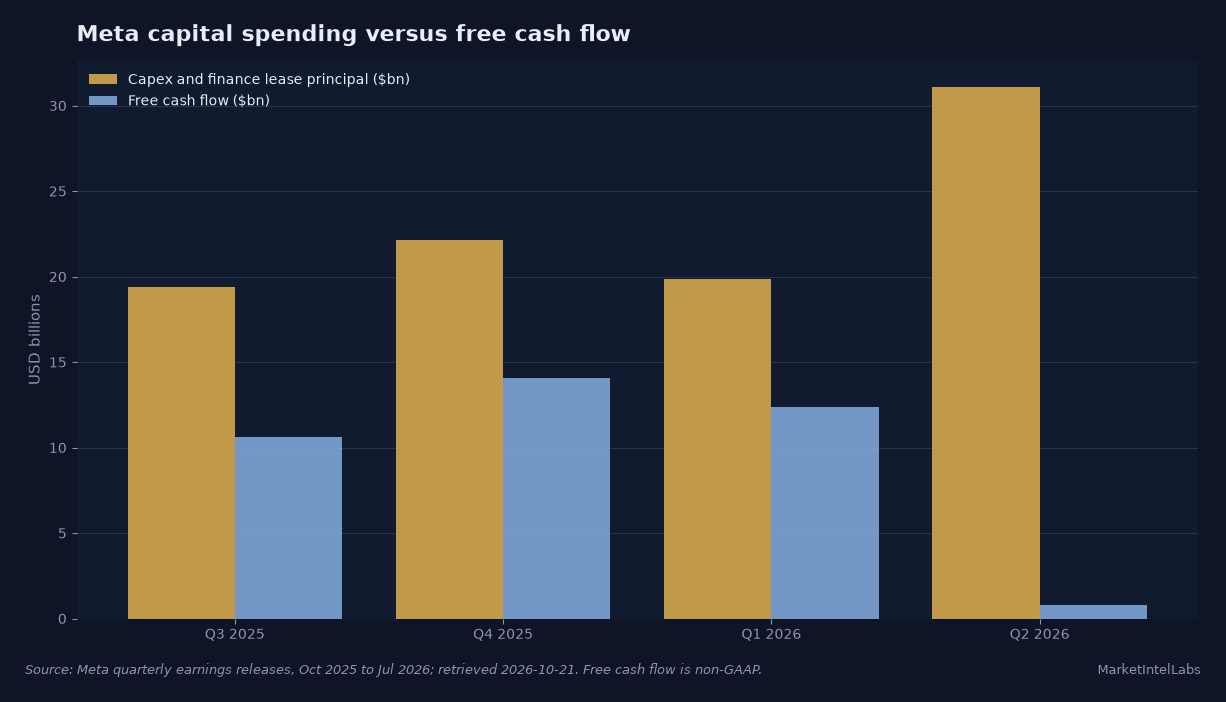
The visually striking point is the June quarter, but it should not be mistaken for four quarters of identical economics. Capital projects are lumpy, and the chart pairs Meta's broad capital spending measure with the company's own free-cash-flow measure. It describes two disclosed series side by side rather than claiming one can always be subtracted from the other to reproduce a third line. Its value is to force the right question tonight: does the September-quarter release show cash generation recovering, a further investment spike, or both?
Looking only at capex misses the business engine; looking only at free cash flow misses the investment cycle. The previous September quarter's $10.62 billion of free cash flow is a useful seasonal reference, but the business and the spending plan have changed. A year-over-year comparison gives context. It does not supply an estimate for the release still ahead.
What the primary documents actually commit to
Meta's October 12 notice commits to timing: results after the close on October 21 and an earnings call at 1:30 p.m. Pacific, or 4:30 p.m. Eastern. It supplies no third-quarter EPS, revenue or cash-flow result. Any number described as actual Q3 performance before the company publishes its release should be treated with skepticism. The company's own second-quarter release is the latest verified quarterly baseline used here.
That July release offered a third-quarter revenue outlook of $61 billion to $64 billion. It assumed foreign exchange would be an approximately 1% headwind to year-over-year revenue growth based on rates at the time. The range is management guidance, not a reported sale. A result inside it may still have different implications depending on advertising pricing, expenses, cash flow and the subsequent outlook. We are deliberately not importing a consensus EPS number from a third-party calendar as though it were an issuer fact.
The second-quarter document projected full-year 2026 total expenses of $165 billion to $169 billion and capex, including principal payments on finance leases, of $130 billion to $145 billion. Management said it expected operating income in 2026 above that of 2025, assuming its outlook holds. The lower capex endpoint had moved up from $125 billion in the first-quarter statement; the upper endpoint remained $145 billion. That narrowing reduces uncertainty about the lower end of spending but does not tell us how much will fall into the September quarter.
The January full-year release described infrastructure costs, including cloud spending, depreciation and operating expenses, as a major contributor to anticipated expense growth. The April quarter then cited higher component pricing as one reason for its raised capital plan. In July, Meta's more expensive investment program coincided with $31.86 billion in operating cash flow and only $784 million in free cash flow. These are company statements at different dates, not interchangeable promises. The October release can update them.
There is a constructive interpretation. If Meta's ad delivery improvements sustain strong pricing and volume, its existing distribution can help pay for new capacity. The second-quarter rise in impressions and price per ad gives that argument a factual base. There is also a harder interpretation: the same release showed a 31% operating margin, down from 43% a year earlier, and a quarter with little free cash flow. That does not prove the investment will fail, but it raises the hurdle for management to show when the cash outlays produce durable incremental earnings.
Balance-sheet context matters without becoming a simple net-cash slogan. At June 30, Meta reported $90.26 billion in cash, cash equivalents and marketable securities and $83.66 billion in long-term debt. It also faces operating needs, capital commitments and returns to shareholders. Cash holdings provide flexibility; they do not make a $130 billion to $145 billion annual spending plan costless. Nor does one heavy quarter by itself imply a funding crisis. The issue is how operating cash and investment needs evolve together.
What comes next for the sector
The next scheduled catalyst is Meta's Wednesday, October 21 release after the US market close. Read the release for reported third-quarter revenue against management's $61 billion to $64 billion prior range, then read operating margin and the statement of cash flows. The 4:30 p.m. Eastern call is where management can explain any change to the $130 billion to $145 billion capex range and the timing of infrastructure deployment. The notice does not guarantee a particular release minute before the call.
A higher spending forecast alongside rising ad revenue could mean Meta sees more profitable demand for compute, or that components and construction cost more than expected. The difference will not be settled by the capex figure alone. Ask whether impressions and price per ad continue to support revenue, whether depreciation and infrastructure running costs lift the expense base, and whether operating cash flow covers investment without materially compressing free cash flow again.
A lower guide is not automatically a bullish signal either. It could reflect efficiency, a facility's schedule moving out, or caution on a project. The release and call need to identify which. For suppliers, a delayed data-center installation can shift expected deliveries even if a customer's long-run demand remains intact. For the broader market, the relevant comparison is between evidence of monetization and the cost of keeping capacity ahead of use, not a one-day judgment on Meta's share price.
The sharpest test after the release will be whether a strong ads print comes with a credible explanation for the cash spent to produce it. We would revise a favorable interpretation if revenue growth weakened while capex and operating expenses rose again. We would revise a skeptical one if operating cash generation recovered and management showed that new capacity was improving ad economics. Neither inference is available from an unpublished quarter. Tonight supplies the first new set of primary numbers.
Frequently Asked Questions
When are Meta earnings in October 2026?
Meta says its third-quarter 2026 results will be released after the US market close on Wednesday, October 21, 2026. Its earnings call is scheduled for 1:30 p.m. Pacific, or 4:30 p.m. Eastern, that day, according to the official announcement. This article was prepared before the result.
What is Meta's 2026 capital spending guidance?
As of the second-quarter 2026 release, Meta anticipated $130 billion to $145 billion in full-year 2026 capital expenditures, including principal payments on finance leases. It narrowed that range from the $125 billion to $145 billion outlook issued after the first quarter. This is a forecast, not actual spending for the completed year.
Why can Meta earnings rise while free cash flow falls?
Net earnings and free cash flow follow different accounting clocks. Cash paid for equipment can leave the company now while depreciation affects earnings over multiple years. Meta reported $31.86 billion in second-quarter 2026 operating cash flow but only $784 million of free cash flow in its own non-GAAP reconciliation while infrastructure investment accelerated. A reader should inspect both the income statement and cash-flow reconciliation.
Does Meta's spending guide predict AI chip stock returns?
No. The guide indicates potential demand for data-center and computing equipment, but it does not specify which supplier wins orders, delivery dates, prices, margins or valuations. Meta's stated capital measure also includes finance lease principal. Supplier filings are needed before converting its budget into any particular company's expected sales or investment outcome.
What should investors check in the Meta Q3 2026 release?
Compare reported revenue with Meta's prior $61 billion to $64 billion third-quarter outlook, then examine ad pricing and impressions, operating margin, operating cash flow, free cash flow and any revised annual capex range. Read management's explanations for changes in capacity schedules or component costs. The figures need to be considered together rather than treating a single EPS or capex headline as the whole result.
This content is for informational purposes only and does not constitute financial advice. Past performance is not indicative of future results. Consult a qualified financial advisor before making investment decisions.
Get daily intelligence delivered
Create a free account for the Daily Brief every weekday and The Week Ahead every Sunday. No card required.