M2 Contracts for Fourth Month: What Liquidity Drain Means for Risk Assets

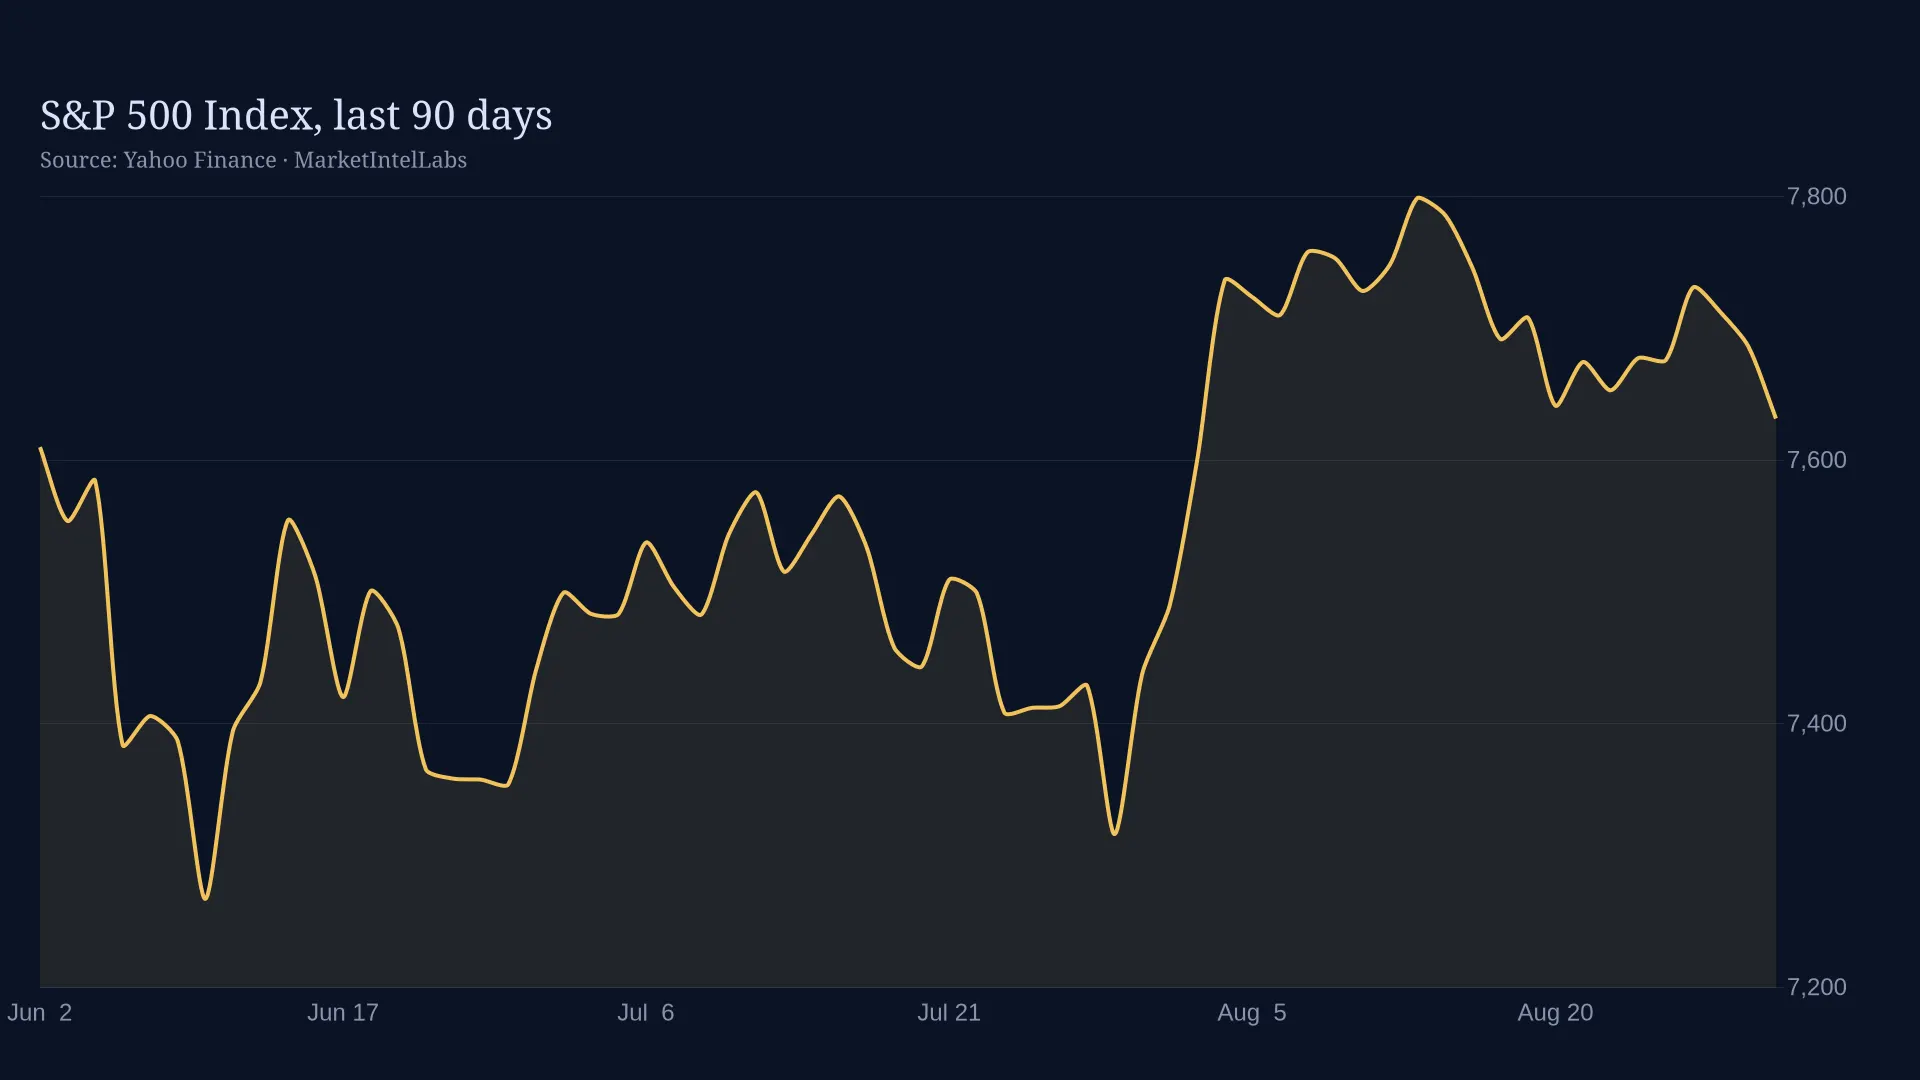
M2 money supply contracted 2.3% year-over-year in July to $23.2 trillion, per Federal Reserve Economic Data (FRED). This was the fourth consecutive monthly decline. The Federal Reserve is draining system reserves through quantitative tightening, and the data shows it. Markets felt the impact on September 2. SPY fell 0.69%. QQQ dropped 1.27%. GLD slumped 2.86%. SLV tumbled 3.68%. TLT declined 0.41%. The dollar index strengthened to 118.75, per ICE data. Real yields are rising and liquidity is contracting, per Treasury market data. Defensive positioning is now the higher-conviction trade given the data.
Key Takeaways M2 money supply contracted 2.3% year-over-year to $23.2 trillion in July, the…
Keep reading with a free account
Get tomorrow's institutional market briefing before markets open, produced by specialized AI analysts researching markets 24/7. Takes under a minute, no card required.
- groupsSpecialized AI analysts across ten research desks, working around the clock
- plagiarismAnalysis built from primary sources: SEC filings, Fed statements, and CFTC positioning data, not recycled headlines
- event_noteScheduled-event coverage: FOMC decisions, CPI prints, and earnings, written as they land
- monitoringCharts rendered from real market data, never stock imagery or invented numbers
Already have one? Log in · Want everything the day it publishes? Go Premium
Secure checkout via Stripe