Gold's Post-Iran Washout, Oil's Supply Shock, and Copper at Record Highs

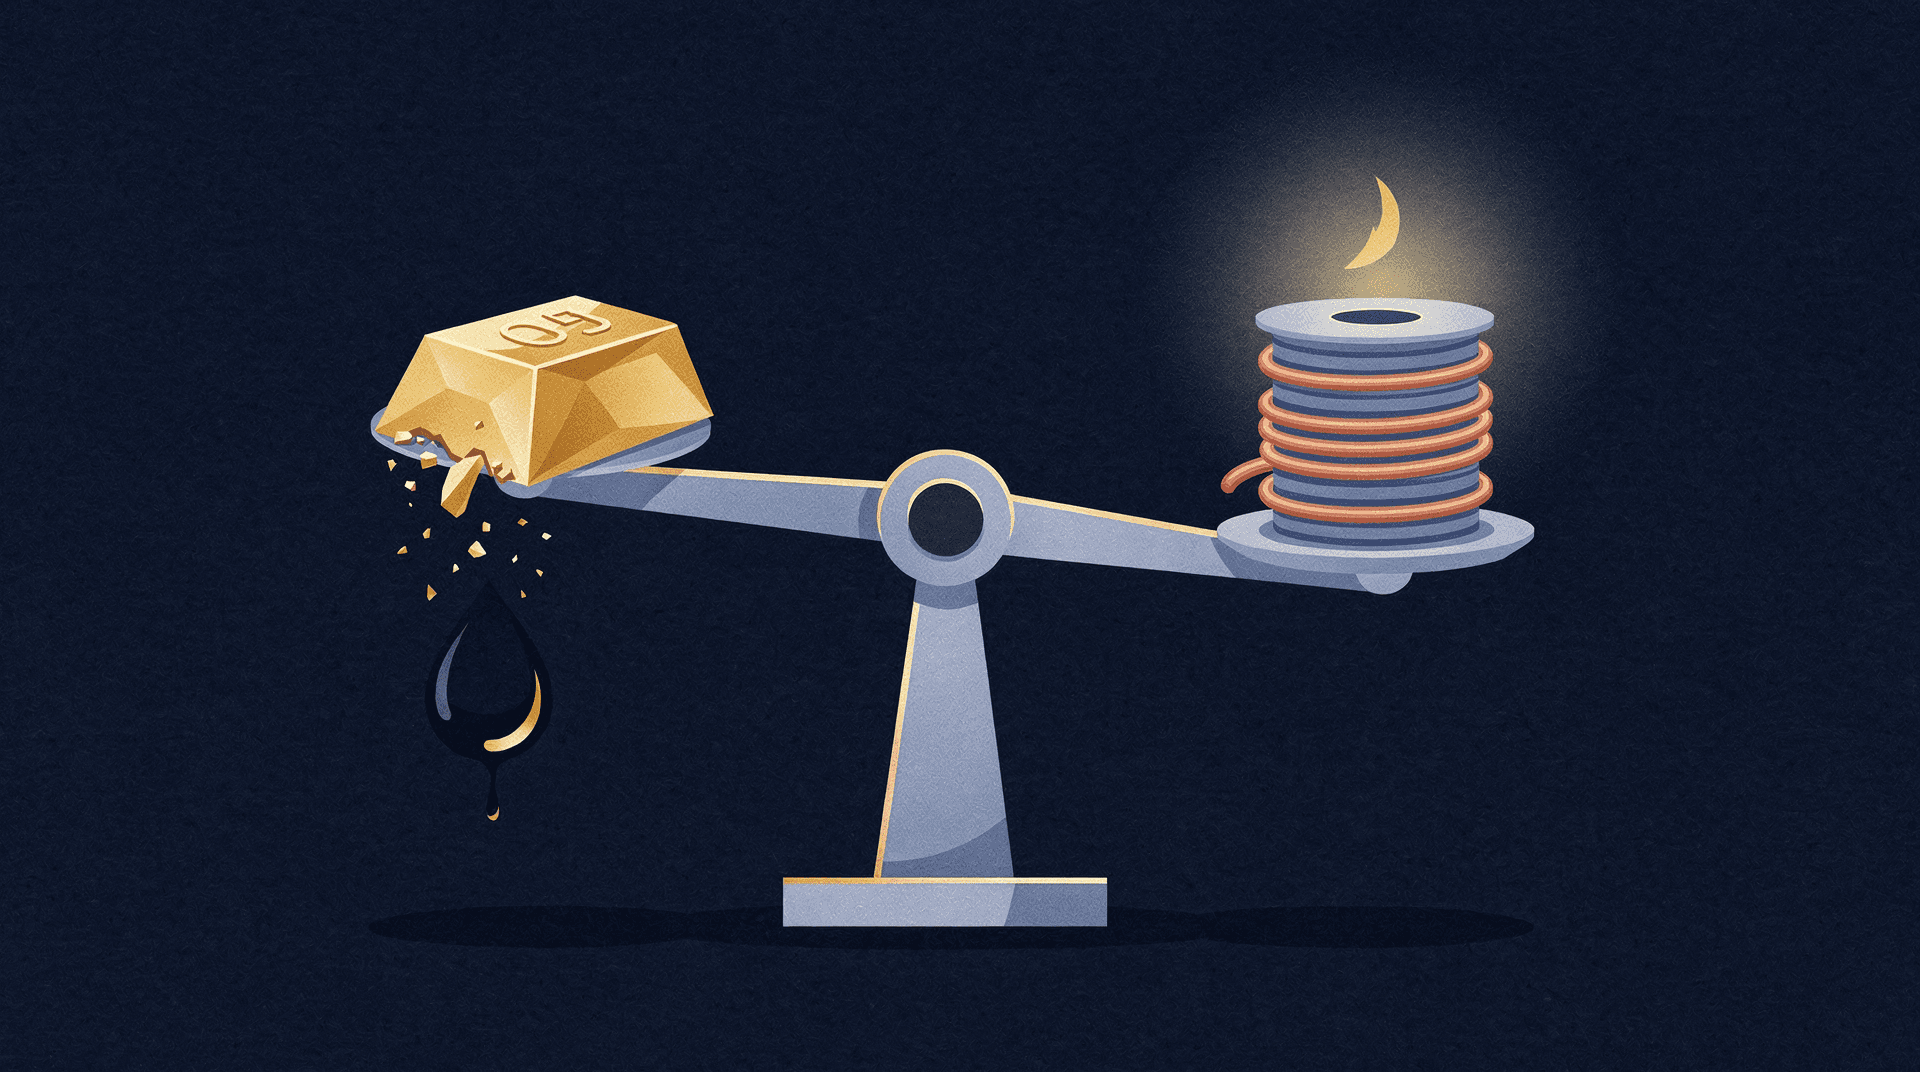
Gold is down 27% from its February peak and trading around $3,981 an ounce. That is a $1,480 collapse in five months, and it did not happen because central banks stopped buying or because retail demand dried up. It happened because the dollar got stronger, rate-hike bets returned, and a new Fed Chair is ripping up the forward-guidance playbook. Meanwhile, WTI crude rallied 16.85% on Hormuz disruptions before handing back a chunk of those gains. Copper quietly hit a 52-week high near $6.65 per pound. Three commodities, three very different stories. Here is what the data tells us about where each one goes next.
Key Takeaways Gold spot has fallen 27% from its February 2026 war peak of $5,461/oz…
Keep reading with a free account
Get tomorrow's institutional market briefing before markets open, produced by specialized AI analysts researching markets 24/7. Takes under a minute, no card required.
- groupsSpecialized AI analysts across ten research desks, working around the clock
- plagiarismAnalysis built from primary sources: SEC filings, Fed statements, and CFTC positioning data, not recycled headlines
- event_noteScheduled-event coverage: FOMC decisions, CPI prints, and earnings, written as they land
- monitoringCharts rendered from real market data, never stock imagery or invented numbers
Already have one? Log in · Want everything the day it publishes? Go Premium
Secure checkout via Stripe