macro

M2 Contraction and Dollar Strength Reshape Market Risk

Published September 2, 20263 min read
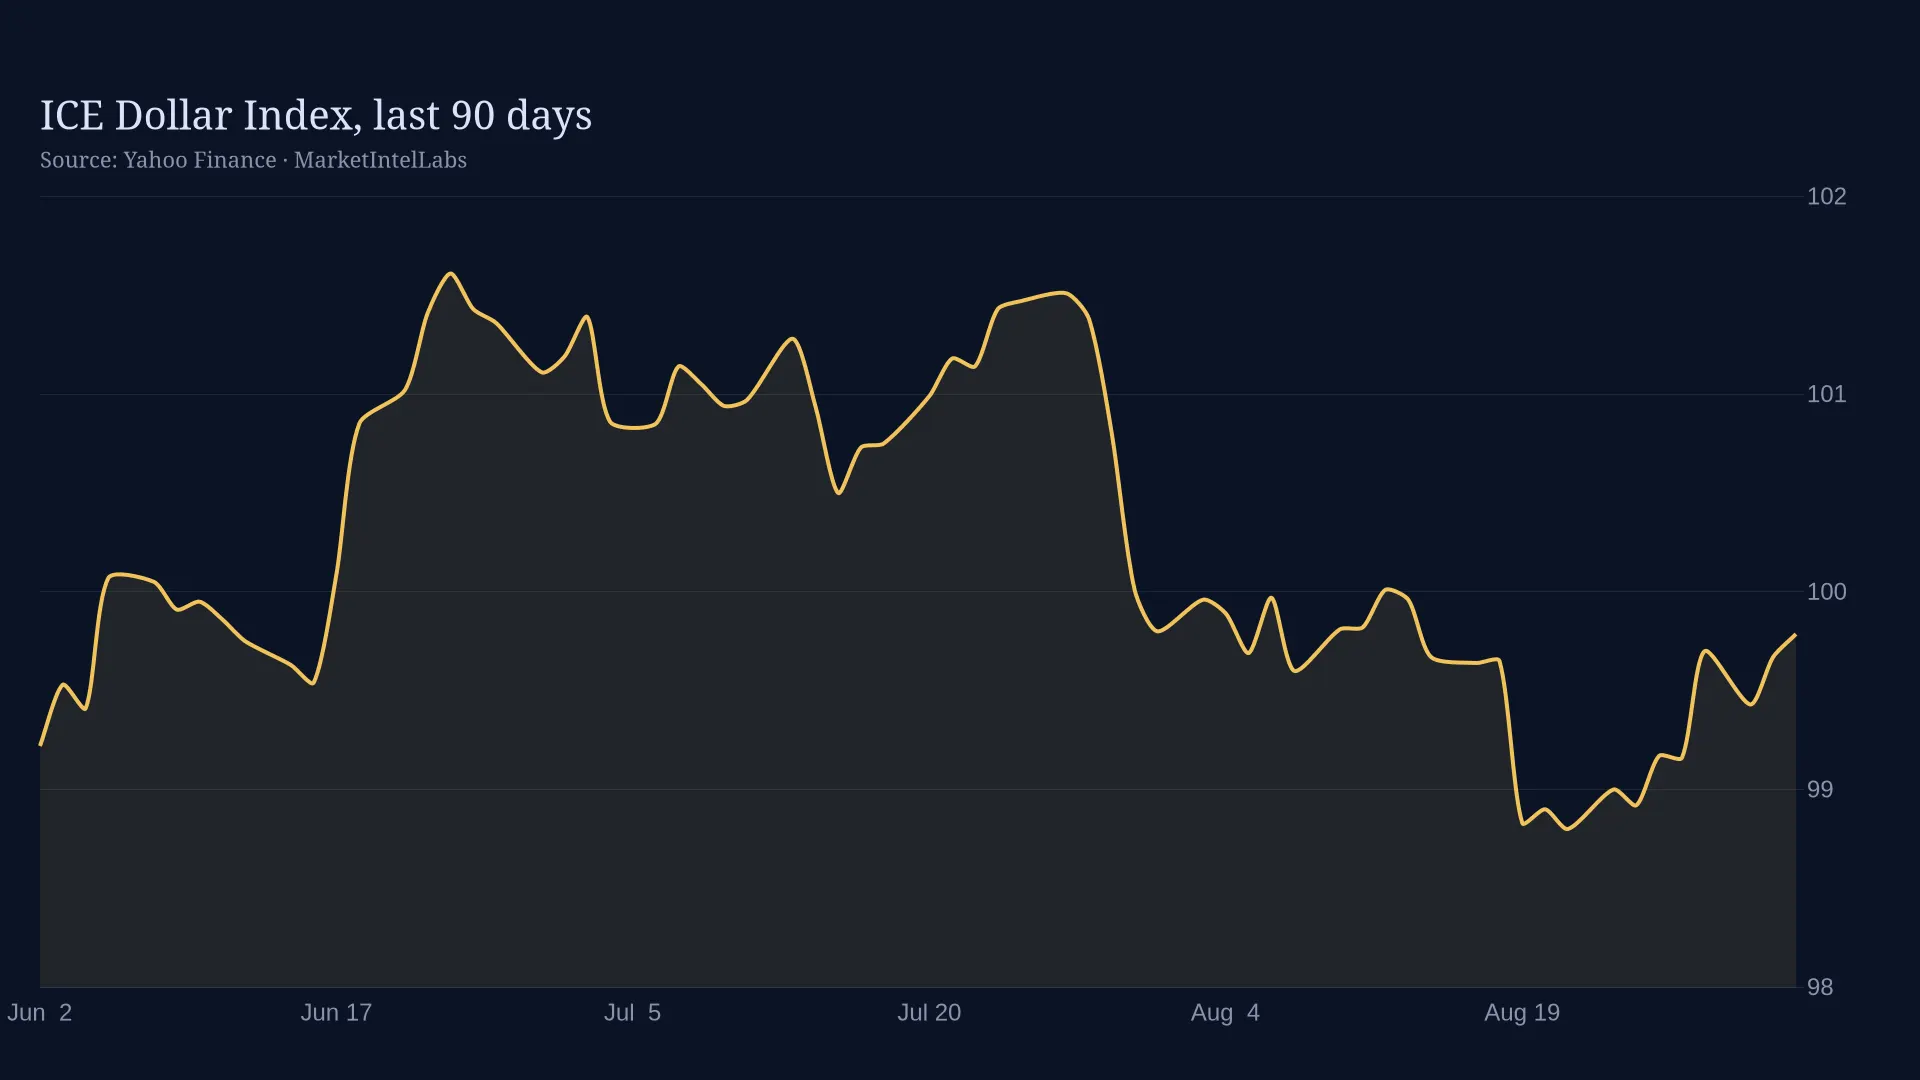
Line chart of ICE Dollar Index, last 90 days on a dark background

Money supply contraction and a surging dollar are reshaping how risk assets perform. According to Federal Reserve data via FRED, the M2 money stock contracted 2.3% year-over-year to $23.2 trillion in July while the ICE dollar index strengthened to 118.75, this creates a tighter liquidity environment that weighs on equities, precious metals, and bonds alike in Wednesday's session. This combination suggests the Fed's restrictive stance is working through the real economy even as the policy rate holds steady at 3.63%.

The transmission mechanism from M2 contraction to market beta works through several channels. The Fed's quantitative tightening program continues draining reserves from the banking system at roughly $80 billion per month, which reduces the supply of dollar funding available to global financial institutions. This reserve scarcity increases dollar funding costs in cross-currency basis swaps, creating upward pressure on the dollar. A stronger dollar makes dollar-denominated assets more expensive for foreign investors, reducing carry-trade flows into risk assets while simultaneously raising the local-currency cost of servicing dollar-denominated debt. This creates a double headwind for equities and emerging-market exposure. The carry unwind feeds back into reduced liquidity in high-beta names, particularly in the technology sector where duration exposure is highest.

The liquidity impact showed up directly in market pricing. Equities sold off across the board with SPY dropping 0.69% and QQQ declining 1.27%, reflecting how technology names with higher duration exposure bear the brunt when real yields rise. Precious metals faced headwinds from the stronger dollar, with GLD sliding 2.86% and SLV down 3.68%, though the underlying inflation story supports gold as a longer-term hedge against currency debasement. Treasuries were not immune, TLT declined 0.41% as the positive yield curve at 40 basis points suggests markets continue to price in steady growth rather than recession.

The labor market remains a point of resilience. According to BLS data, unemployment held steady at 4.1% in July, indicating the Fed has not yet broken the employment side of its mandate even as monetary conditions tighten. This persistence in job growth makes the path to rate normalization more complicated. The Fed cannot easily ease policy while the labor market shows strength, yet the ongoing M2 contraction shows that current policy is restrictive enough to drain liquidity from the financial system.

Inflation pressure remains the constraint on policy flexibility. According to BLS CPI data, the index at 332.8 points to persistent price pressure, up 0.8% from the same period a year earlier. This keeps the Fed in a holding pattern rather than a cutting cycle. The central bank's data-dependent framework remains dependent on whichever data supports the current narrative, and right now the inflation data argues for maintaining a restrictive stance even as liquidity drains.

The bull case for risk assets deserves equal weight despite the current headwinds. M2 contraction is a lagging indicator, and the dollar strength reflecting a US growth differential could signal resilience in domestic demand relative to global peers. The positive yield curve suggests recession is not the base case, and if the M2 contraction stabilizes in the next monthly print, the liquidity drain could be priced in. Additionally, the Fed's terminal rate may be lower than markets currently fear if inflation continues moderating, creating room for a policy pivot before significant economic damage occurs.

The market implications are clear. Risk assets face headwinds from both tighter liquidity and a stronger dollar. Equity investors should expect continued volatility as the market prices in the lag effect of past tightening. The positive yield curve suggests recession is not the base case, but growth is likely to slow. Precious metals face near-term pressure from dollar strength even as their long-term inflation hedge thesis remains intact. Bonds offer some buffer in a diversified portfolio, but the positive curve means duration risk remains real.

What to watch next. The September M2 print will be the critical test for whether the liquidity contraction is accelerating or stabilizing. If M2 expands month-over-month or the contraction rate narrows below 2%, it would signal the liquidity drain is bottoming and support a constructive view on risk assets. The October FOMC dot plot will reveal whether Fed officials have adjusted their terminal rate projections down from the current 3.63% median estimate. Any downward revision of 25 basis points or more would indicate a growing consensus that restrictive policy has done its work. The next unemployment print dropping below 4% would strengthen the bull case by showing labor market resilience, while a rise above 4.3% would signal that restrictive policy is finally breaking through to the real economy and create room for easing.

This content is for informational purposes only and does not constitute financial advice. Past performance is not indicative of future results. Consult a qualified financial advisor before making investment decisions.

Get daily intelligence delivered

Create a free account for the Daily Brief every weekday and The Week Ahead every Sunday. No card required.