Beyond the Fed Rate Decision: What Q2 Growth and Yield Curve Signals Mean for Markets

Related Reading The Yield Curve's Quiet Warning: Treasury Yields Rise and the Spread Narrows Fed Holds as Growth Accelerates and Inflation Slows Inflation Stays Tame, Unemployment Falls to 4.1 Percent: Today's Data Recap For more analysis, see our Fed policy coverage .
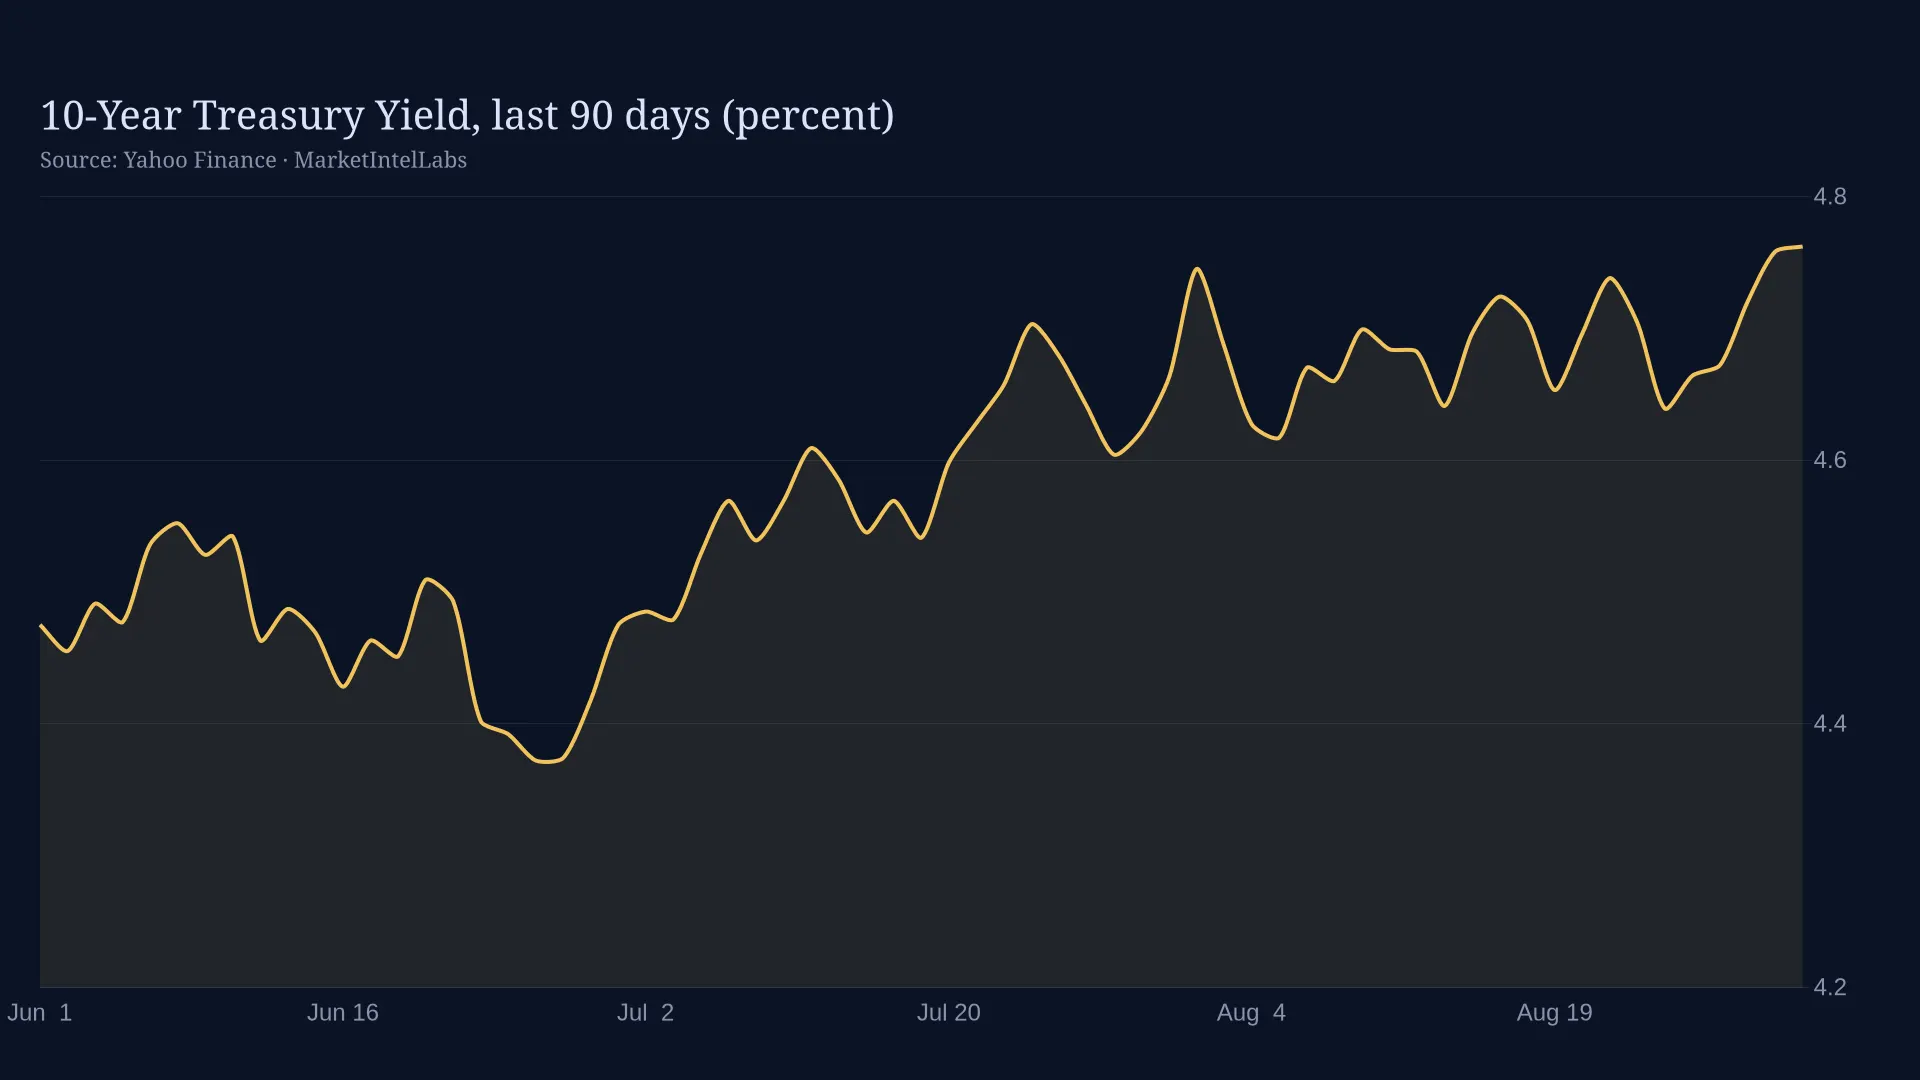
The Federal Reserve held rates steady at 3.63% in July, but that is not the story. The story is what happened while the Fed sat still. Real GDP grew 1.9% quarter-over-quarter in Q2 2026, the unemployment rate dropped to 4.1%, and the yield curve steepened as 10-year Treasury yields climbed 13 basis points to 4.60%. This combination of accelerating growth, easing inflation, and a tightening labor market creates a rare policy puz…
Keep reading with a free account
Get tomorrow's institutional market briefing before markets open, produced by specialized AI analysts researching markets 24/7. Takes under a minute, no card required.
- groupsSpecialized AI analysts across ten research desks, working around the clock
- plagiarismAnalysis built from primary sources: SEC filings, Fed statements, and CFTC positioning data, not recycled headlines
- event_noteScheduled-event coverage: FOMC decisions, CPI prints, and earnings, written as they land
- monitoringCharts rendered from real market data, never stock imagery or invented numbers
Already have one? Log in · Want everything the day it publishes? Go Premium
Secure checkout via Stripe