Weekly Jobless Claims Today: 197,000 Before New Release


Weekly jobless claims today have not yet been released. The U.S. Department of Labor normally publishes its Thursday unemployment insurance report at 8:30 a.m. Eastern, or 12:30 UTC; the October 15 number remains pending at this writing. As of this morning, the latest published report covers the week ending October 3: 197,000 seasonally adjusted initial claims, down 2,000 from a prior week revised upward to 199,000. The four-week average was 198,000. Calling the October 15 figure before its release would confuse a forecast with an observation.
The distinction matters more than the one-week decline. New applications have stayed close to 200,000, while the last reading of continuing claims rose. That combination suggests employers were not broadly accelerating layoffs through early October, but says less about whether workers who lost jobs were finding new ones quickly. Our September jobs and claims briefing provides the monthly backdrop; this feature explains how to interpret the Thursday release without treating it as a payroll report.
Related reading: Jobless Claims Hit 196,000, a 1960s-Level Print Firms Are Not Firing.
How we got to Thursday's release
The Labor Department's October 8 claims release put the advance seasonally adjusted initial-claims count for the week ending October 3 at 197,000. It revised the September 26 week upward by 2,000, from 197,000 to 199,000, so the new week's published decline was 2,000 rather than zero. The average of the latest four weeks fell by 2,500 to 198,000; the previous average was itself revised up by 500 to 200,500. Revisions belong in the comparison, not in a footnote readers never see.
For the week ending September 26, a different reference week, seasonally adjusted insured unemployment rose to 1,716,000 from a prior reading revised down to 1,699,000. That was an increase of 17,000; its four-week average declined by 12,250 to 1,711,000. The insured unemployment rate was 1.1 percent. Initial claims and continuing claims therefore pointed in somewhat different directions on their latest available weeks. Neither number measures everyone who is out of work.
Related reading: Unemployment Claims Stay Low as Continuing Claims Rise to 1.716 Million.
The unadjusted figures give another way to check the headline. The department counted 170,333 actual initial claims in the October 3 week, up 11,994 from the preceding week; seasonal factors had anticipated an increase of 13,725. The comparable week in 2025 had 207,124 unadjusted filings. The raw level rose even as the adjusted headline fell because the seasonal pattern predicted a larger increase. It would be a mistake to call those two observations contradictory or to compare the raw 170,333 directly with the adjusted 197,000.
The Federal Reserve Bank of St. Louis ICSA series, retrieved for this feature with the FRED API through October 3, shows 200,000 for August 1, 212,000 for August 8, 207,000 for August 15, 204,000 for August 22 and 207,000 for August 29. September 5 was 207,000, September 12 and 19 were 198,000 each, September 26 was 199,000 and October 3 was 197,000. These are observations as available on October 14, not forecasts for October 10. The ten-week span ranges from 197,000 to 212,000, an orderly range on its face, though it cannot rule out deterioration after the last observation.
The jobs picture is quieter than a claims-only reading suggests. In its September employment report, the Bureau of Labor Statistics said employers added 29,000 payroll jobs, compared with an average monthly gain of 45,000 over the previous 12 months, while the unemployment rate was 4.2 percent. BLS described the monthly change in both payroll employment and unemployment as small. A low count of people newly applying for benefits can coexist with slow net job creation when employers hire cautiously and fire cautiously. The household survey's unemployment rate and the establishment survey's payroll count are separate measures, not two versions of weekly claims.
Hiring has its own lagged lens. The BLS August Job Openings and Labor Turnover Survey counted 7.1 million openings, 5.2 million hires, 5.1 million separations, 3.1 million quits and 1.6 million layoffs and discharges. Those are monthly survey estimates for August, whereas claims are weekly administrative filings, so do not line up one number against another as though they cover the same people and dates. The openings figure captures positions open on the last business day of August; hires and separations cover the month. Together they allow a different question: are workers moving into jobs as easily as the low claims tally might imply?
What a claim measures, and what it misses
An initial claim begins when a worker files for unemployment insurance after separating from an employer. The Labor Department's national weekly claims dataset documentation says state UI offices report claims first according to the state liable for benefit payment and then revise the counts using a second report reflecting claimants by state of residence. An initial filing is an application for a determination of basic eligibility. It is not a verified layoff total, a count of all unemployed people, or a guarantee that the filer will receive benefits. A recently laid-off person who does not file is absent from this count.
Continuing claims, also called insured unemployment, reflect people filing for another week of benefits after an initial application and a week of unemployment. They usually arrive with a one-week lag relative to initial claims in the same Thursday release. That lag is why the October 8 packet pairs October 3 initial claims with September 26 continuing claims. A rise in continuing claims might mean it is taking longer for insured workers to leave the benefit rolls, but administrative delays, eligibility and the number of new entrants can also affect the count. It is evidence about insured claimants, not an exact measure of job-finding time for the entire labor force.
The distinction between claims and the unemployment rate is more than a technicality. The 4.2 percent unemployment rate in the September BLS release comes from a household survey about labor force status. A respondent can be unemployed and never apply for benefits; someone can file a claim and later be found ineligible. Payrolls come from an establishment survey of jobs, not individuals seeking assistance. A better reading uses all three and asks whether a change is broad, repeated and consistent across measures. If one Thursday print jumps and the monthly measures do not, the burden of evidence stays with the next few weeks of claims.
Seasonality makes the single week even less decisive. The BLS methodology for weekly UI claims names weather, holidays and school schedules as regular sources of variation. BLS supplies seasonal factors for the Labor Department's initial and continued claims series. For the current year it projects factors from earlier observations and later re-estimates them, revising historical adjusted data. Its methodology explains why an unadjusted increase can translate into a seasonally adjusted decrease and why a neat-looking week-over-week comparison can change the following Thursday.
There is a policy channel, but no mechanical conversion from a 2,000-person change in filings to a bond yield or an interest-rate decision. Investors use claims as one fast indicator of labor-market pressure. A sequence of higher initial claims coupled with rising continued claims would make weaker employment a more plausible interpretation, potentially affecting expectations for future Federal Reserve policy. Yet inflation, wages and growth also matter. The Federal Reserve's September 16 statement said job gains had kept pace with the workforce, unemployment had changed little, and inflation remained elevated when it raised its target range to 3.75 to 4 percent. That is the Fed's stated assessment at that date, not a promise about its next vote.
For a worker, the question is different from a market desk's reaction to a Thursday release. Claims data cannot tell an individual whether they qualify for benefits or when a state will pay a pending application. State rules and the worker's own claim determine that. At the economy-wide level, falling new filings lower the immediate evidence of layoffs. They do not prove that firms are posting jobs, that displaced workers can get interviews, or that real wages have improved. Our report on September real average hourly earnings addresses that last issue using a different release.
The chart: a narrow recent band
The chart plots the ten available weekly ICSA observations from August 1 through October 3, with values in thousands. It deliberately stops at the last observed week. The high point is 212,000 on August 8, and the low point is 197,000 on October 3. The visual supports a limited claim: recent filings have not shown a sustained upward run through the last published week. It does not show what happened in the week ending October 10, which is what Thursday's new initial-claims figure is expected to describe.
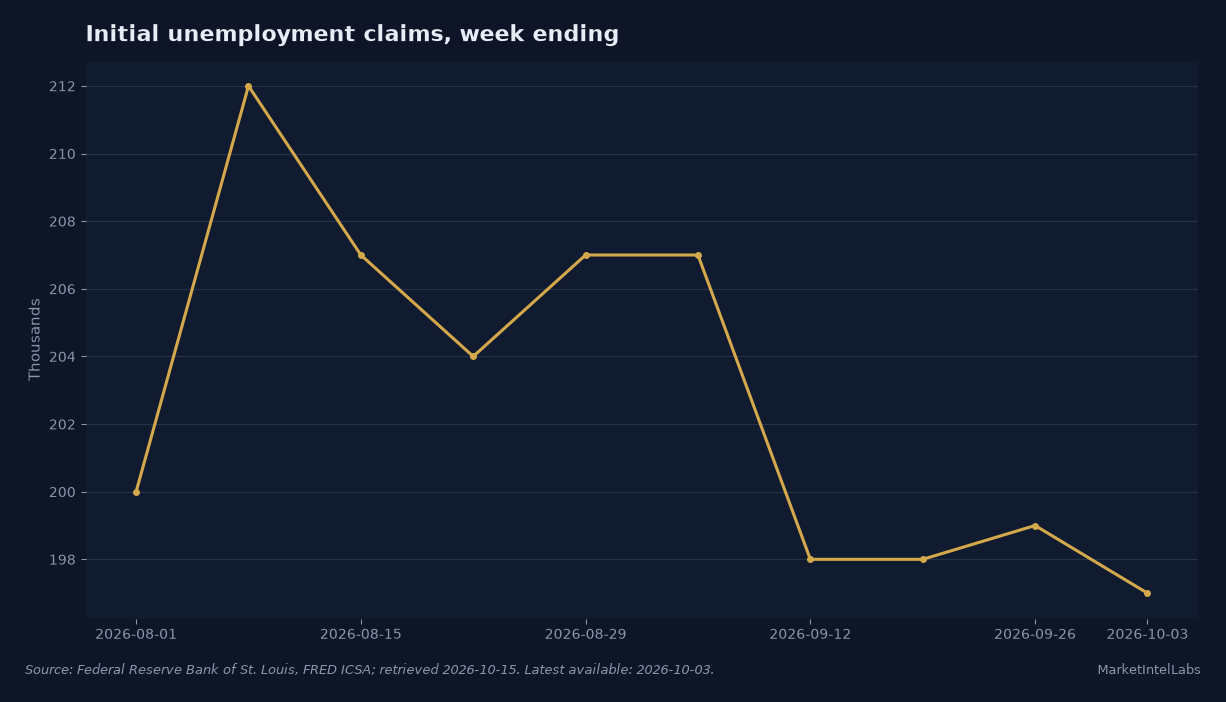
The table behind the chart uses the dated FRED ICSA observations, not interpolated figures. The latest initial print was 197,000 versus the prior revised 199,000; the seasonally adjusted initial-claims four-week average was 198,000 in the Department of Labor release. A comparable year-ago figure available from that same release is 207,124 for the October 3 week of 2025, but it is unadjusted and therefore is not plotted against the adjusted ICSA series. No verified consensus forecast is included because we did not retrieve a primary forecast dataset. Mixing those definitions would produce a prettier but false comparison.
One caution for any chart reader: a ten-week window is selected for legibility, not because labor cycles last ten weeks. The plot shows an increase from 200,000 to 212,000 in early August and a return toward 200,000 afterward. It cannot answer whether the October 3 low will persist. The four-week average from the Labor Department is the immediate noise filter; the next several Thursday releases will tell more than the last point on the line. Claims often look stable until they do not, and equally often one noisy jump fades at revision.
Where the official documents agree and differ
The Department of Labor's weekly release and its dataset documentation agree on the scope: initial filings give an early read on emerging conditions, while continuing claims provide confirmation about insured unemployment. The data portal explicitly warns that weekly administrative numbers are difficult to adjust for seasonality and are volatile. BLS explains the adjustment's statistical purpose, but that method does not eliminate every holiday effect or make a claim equivalent to a layoff. That is a reason to examine the adjusted series and the raw counts side by side, not a reason to discard either.
The September BLS jobs report and August JOLTS add a useful disagreement of emphasis. The jobs report shows a small 29,000 payroll gain and a 4.2 percent unemployment rate; JOLTS shows that 5.2 million hires and 5.1 million separations occurred in August. Weekly new claims near 200,000 do not invalidate the slower payroll increase. One set describes new claims for insurance, one net employment, and one gross job movement. Our assessment is that the labor market looks more restrained in hiring than stressed by new claims, but that reading would weaken if initial claims and continuing claims rose together for several weeks.
Revisions are the most immediate reason to avoid a dramatic interpretation on Thursday. The October 8 release changed the previous initial-claims week from 197,000 to 199,000 and the previous continuing-claims week from 1,701,000 to 1,699,000. If a first comparison uses the old value, the direction or size of the change can be misstated. The revision is not an admission that the series is unusable; the state offices report on a schedule and update it as more information arrives. The Department's public data description spells out the first and second reporting steps.
There is also no clean investment conclusion from a low claims figure alone. Lower layoffs may support household income, while weak hiring can still slow wage gains and spending. Higher claims might bring the possibility of easier future policy into market pricing, but would also imply more job loss. A claim about the direction of stock prices from one week's filings would pretend those countervailing channels cancel in a known way. They do not. We use the release to test a labor-market thesis, not to prescribe a transaction.
What is dated next
The next Labor Department claims release is due Thursday, October 15, at 8:30 a.m. Eastern. Before that timestamp, the October 10 initial-claims count, any revisions to October 3, and the new continuing-claims figure should be treated as unknown. When the document arrives, compare the new initial count with the revised October 3 baseline, not the 197,000 printed in last week's first release if that baseline changes. Compare the four-week average with its newly revised predecessor. Then inspect raw counts and seasonal factors for the same reference week.
Watch whether continuing claims confirm the direction of new applications. If the initial count rises for one week while the four-week average remains near 198,000, that is a weaker signal than a sequence of higher averages. If continued claims rise alongside initial claims, the case for labor-market deterioration becomes stronger, though benefit-system effects still need checking. If initial claims remain close to recent levels while continuing claims keep increasing, the issue may be the rate at which insured workers exit unemployment, not a sudden wave of new filings.
The BLS JOLTS release dates its September report for November 3 at 10:00 a.m. Eastern. That later document will test hiring, quits and layoff behavior with a different design and monthly reference period. The next payroll report provides another test when published on the BLS calendar; its result is not in today's record. Until then, the disciplined headline is that the last reported initial claims were 197,000 and the next number is pending. A reader searching the answer this morning deserves the distinction.
Frequently Asked Questions
What are weekly jobless claims today?
At this October 15 morning writing, the new weekly number has not been released. The latest Labor Department advance seasonally adjusted initial-claims figure is 197,000 for the week ending October 3. The October 15 release is scheduled for 8:30 a.m. Eastern and is expected to cover the next week. This article does not insert an estimate in place of the pending government figure.
When do weekly jobless claims come out?
The U.S. Labor Department normally publishes the unemployment insurance weekly claims report on Thursday at 8:30 a.m. Eastern. For October 15, 2026, that is 12:30 UTC. The initial and continuing figures in each packet refer to different week-ending dates, with continuing claims typically one week behind initial claims. Check the release date and each series' reference week before quoting them.
What is the difference between initial and continuing claims?
Initial claims are applications made after a worker's separation from an employer. Continuing claims count insured unemployed people who file for another week of benefits. Initial applications can reveal emerging stress sooner, while continued filings say more about the stock of people still claiming. Both cover the unemployment insurance system, not everybody without a job, and each can be revised as states send more complete reports.
Do lower jobless claims mean unemployment is falling?
Not necessarily. Lower initial claims point to fewer new benefit applications after adjustment for normal seasonal patterns; they do not measure all unemployed workers or the number being hired. September's unemployment rate was 4.2 percent in the BLS household survey even as the latest claims reading remained near 200,000. To assess whether unemployment is falling, use the household survey and read claims alongside payrolls and JOLTS.
Why do jobless claims numbers change after release?
States first report claims according to the state responsible for paying benefits and submit a second report with more complete information. The Labor Department revises prior readings when those data arrive, while BLS also updates seasonal factors. For example, the department revised initial claims for the week ending September 26 from 197,000 to 199,000 in the October 8 release. The right week-over-week comparison uses the revised baseline.
This content is for informational purposes only and does not constitute financial advice. Past performance is not indicative of future results. Consult a qualified financial advisor before making investment decisions.
Get daily intelligence delivered
Create a free account for the Daily Brief every weekday and The Week Ahead every Sunday. No card required.