Initial Jobless Claims Actual: 194,000 Before Nov. 5 Update


The latest initial jobless claims actual is 194,000 seasonally adjusted for the week ended October 24, 2026, according to the Labor Department's October 29 release. That is 1,000 below the prior week's revised 195,000, while the four-week average fell to 196,750 from a revised 198,000. The next release, covering the week ended October 31, is due Thursday, November 5; its actual number is not yet published. The current read says relatively few covered workers are starting claims, not that the labor market is generating many new jobs.
There are two meanings of actual here. Searchers often mean the newly released headline, a seasonally adjusted estimate. The Labor Department also calls its raw count of claims actually filed an unadjusted actual: 178,851 in the October 24 week. The difference matters because a raw increase can coexist with a seasonally adjusted decline. The same release says raw filings rose by 5,648 from the preceding week, while the seasonal pattern anticipated a rise of 6,040. The headline adjusted count accordingly fell by 1,000. If those figures seem contradictory, they are asking different questions.
For context, our report on the October 29 weekly release covers the immediate print; this feature explains how to read the series before Thursday's update. A low claims number is evidence against a broad wave of newly filed benefit applications. It is not proof that every job loser qualifies for benefits, or that someone whose application was denied has found work. The Labor Department's national weekly claims dataset describes claims as administrative records submitted by state programs, not a census of all job loss.
For the broader framework, see our Fed policy coverage.
How the claims series got here
The October 24 reading was not a sudden one-week collapse. The Labor Department's eight-week historical table reports seasonally adjusted initial claims of 207,000 for September 5, then 198,000 for September 12 and September 19. They measured 199,000 for September 26, 198,000 for October 3, 200,000 for October 10, 195,000 for October 17 and 194,000 for October 24. That pattern looks more like a drift around 200,000 than a straight line; the October 10 increase is visible between declines.
The four-week average gives that drift a cleaner outline. It was 206,250 for September 5, 204,000 for September 12, 202,500 for September 19 and 200,500 for September 26. The next readings were 198,250, 198,750, 198,000 and 196,750 through October 24, as shown in the same published history and the Fed's IC4WSA series. A small weekly rise on October 10 did not reverse the eight-week decline in the average. That is why the average belongs beside, not instead of, the latest weekly count.
The comparison with the same week a year ago also matters. The release's regular state program table lists 221,000 seasonally adjusted initial claims and a 226,750 four-week average for its prior-year comparison. The latest 194,000 and 196,750 are below those figures. In raw filings, the comparable prior-year week had 203,012 claims against 178,851 now. These are differences between published points, not estimates of the number of people who entered employment or proof that layoffs have disappeared.
The agency revised the previous week's initial count upward by 1,000, from the originally reported 194,000 to 195,000, before comparing it with October 24. The prior four-week average was likewise revised upward by 250 to 198,000. The current release therefore describes a 1,000 weekly decline and a 1,250 decline in the average. Comparing the new 194,000 against last week's first estimate of 194,000 would give a misleading impression of no change. Revisions are routine because the preliminary state reports are not the final records.
Our October employment report preview gives the monthly backdrop without turning claims into payrolls. The Bureau of Labor Statistics September employment release put job growth at 29,000 and unemployment at 4.2%. July payrolls were revised down by 31,000 to a decline of 10,000, while August was revised down by 29,000 to a gain of 133,000. Together those two months were 60,000 below the earlier estimates. The release says the prior 12-month average monthly payroll gain was 45,000. That is a slower hiring picture than the calm weekly initial-claims line might imply by itself.
The BLS household survey also measured 7.1 million unemployed people in September and an unemployment rate that had stayed within 4.1% to 4.3% since March. Those survey measures ask who is working and actively seeking work, whether or not a person has filed a successful insurance claim. The employer survey, which produces payroll job growth, asks a different population about paid positions. Treating the three series as if they count the same people creates false puzzles. A low number of new benefit applications can occur alongside modest net hiring when employers hold existing staff but open fewer positions.
What a claim measures and what it cannot measure
First comes separation from work. An unemployed person submits an initial unemployment insurance claim to request a determination of eligibility. States report those applications to the federal Employment and Training Administration. The Labor Department's data definition says the first advance count is based on filings taken by the state liable for benefits, regardless of where the claimant lives; the following report revises counts using a second submission organized by state of residence. A filed claim is not a granted benefit, and neither category is equivalent to every job loss in the United States.
Eligibility rules, coverage and individual decisions affect how much of the displaced workforce appears in administrative records. Someone outside covered employment or someone who never applies does not appear as a new initial claim merely because a job ended. The portal calls initial claims a leading indicator of emerging labor market conditions but cautions that weekly administrative data are volatile and difficult to adjust for seasonal patterns. Leading does not mean infallible. Claims are unusually timely; they are incomplete as a measure of every form of employment distress.
Seasonal adjustment makes weeks more comparable by allowing for recurring changes in filing patterns around holidays, weather and school calendars. The Labor Department's release notes say BLS supplies seasonal factors and ETA revises historical claims when underlying raw counts are updated. The dataset field definitions distinguish raw initial claims, adjusted initial claims and the four-week average as separate columns. The October 24 raw count increased by 3.3%, less than the 3.5% increase implied by the seasonal factors. That is the operational reason the adjusted count can go down while the unadjusted count goes up.
Continued claims answer another question: how many weeks of benefits people already on the rolls requested. The October 29 release reports 1.701 million seasonally adjusted continued claims for the week ended October 17, down 21,000 from the revised 1.722 million a week earlier. Its four-week average was 1.710 million, up 500 from the prior revised average of 1.7095 million. Note the one-week lag. The latest initial claims are dated October 24, but the newest continued claims in that release are dated October 17. Calling both figures an October 24 measure would put different reporting weeks into one false comparison.
The Labor Department's dataset explanation describes continued claims as a rough approximation of insured unemployed workers currently filing for benefits. The October 17 insured unemployment rate was 1.1%, unchanged from the week before, according to the weekly release. It is not the same as BLS's 4.2% September unemployment rate. One divides insured claimants by covered employment under the program's definition; the other comes from a household survey of the civilian labor force. The lower insured rate is not a hidden correction to the unemployment rate.
The mechanism for markets is indirect. Claims can alter expectations for the pace of labor-market cooling, which investors may feed into their view of future Federal Reserve policy and Treasury yields. But the Fed has an employment and price-stability mandate, not a rule that maps 1,000 fewer applications into a preset rate decision. A downside surprise in claims might strengthen the case that layoffs remain contained; a persistent rise together with weaker hiring would point the other way. Inflation and other labor data can outweigh either reading. This is an interpretation framework, not a trading signal.
A quiet layoffs story is compatible with an uneasy job search. A company can avoid dismissals and still postpone new hiring. The BLS September JOLTS release counted 7.5 million job openings, 5.4 million hires and 5.3 million separations. It said quits rose to 3.4 million while layoffs and discharges were little changed at 1.6 million. Openings are vacancies at a month's end; hires and separations are transactions throughout the month. Initial claims represent applications for a narrower insurance program in a specific week. That is why JOLTS vacancies can firm while weekly claims remain subdued and monthly payroll gains stay modest.
The eight-week comparison in one chart
The original chart below plots the eight dated observations in the Labor Department's published historical table against the same series retrieved through the St. Louis Fed's ICSA and IC4WSA records on November 4. Weekly initial claims fell from 207,000 on September 5 to 194,000 on October 24, while the four-week average fell from 206,250 to 196,750. The small October 10 rebound in the weekly series is exactly the sort of movement that the average tempers. Both lines use thousands of claims, and neither includes an unreported October 31 figure.
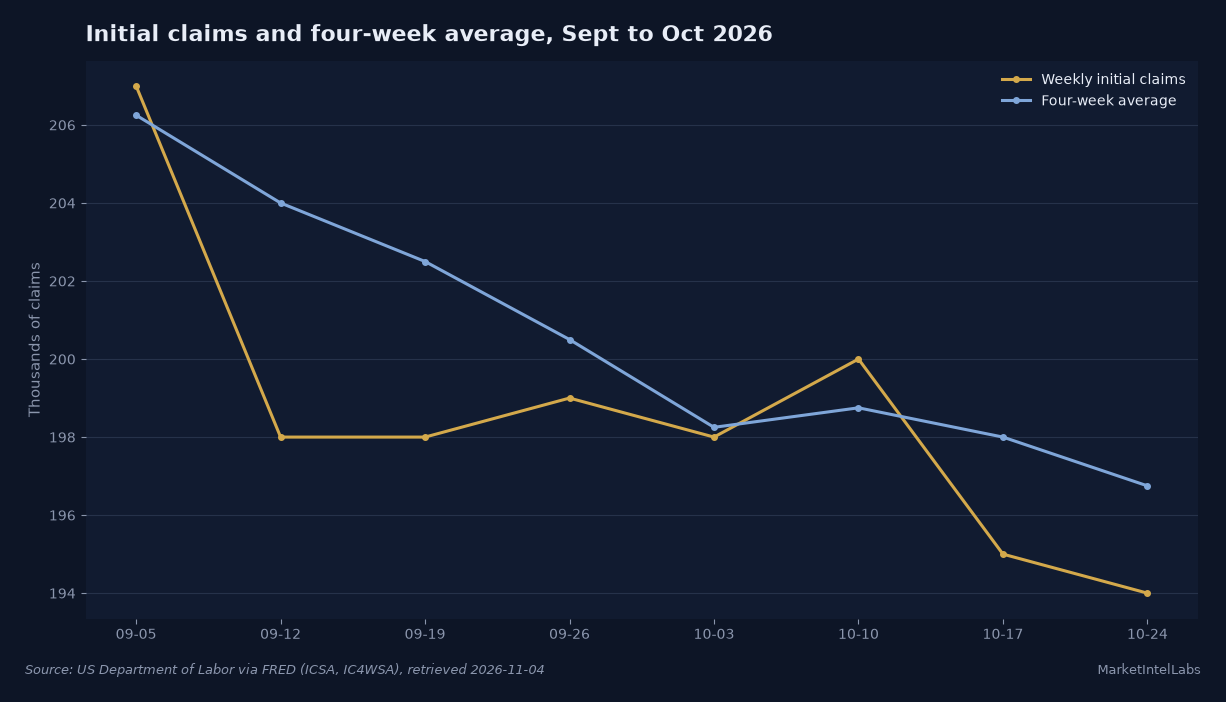
Charting both lines avoids a familiar error: drawing a conclusion from a single point because it is the freshest. The average can remain lower even if one weekly print bounces, as the October 10 observation shows. Conversely, a falling average will eventually turn if enough higher weekly readings enter the window. It is not a forecast. Four-week smoothing reduces noise at the cost of responding later to a genuine change. Read it alongside the weekly number and the revision, not as a substitute for either.
There is no consensus estimate in this chart. Consensus varies across forecasters, and this original table consists only of official published observations. Nor is the year-ago point squeezed onto an eight-week line as though it were a ninth consecutive week. The release's separate prior-year comparison, 221,000 initial claims for the comparable week, serves that purpose. The boundaries of the display matter: an honest chart needs to show what its x-axis actually measures. All eight points are dated September or October 2026.
What the primary documents say about the disagreement
The Labor Department's October 29 report offers the narrowest conclusion: adjusted initial claims fell modestly, the four-week average declined and continued claims fell for their separately dated week. It does not announce an expansion of hiring. BLS supplies that missing hiring context. In the September employment report, payrolls grew 29,000, and BLS described little change across major industries. Health care added 17,000 positions, less than its preceding 12-month average monthly gain of 33,000; construction added 11,000 and manufacturing 9,000, both described by BLS as little changed. None of those monthly sector counts is a subset of the weekly claims figure.
The September JOLTS release makes the tension clearer. BLS reported 7.5 million openings and higher quits, yet layoffs and discharges held near 1.6 million. The August openings estimate was revised upward by 111,000 to 7.2 million, another reminder that comparisons move after first publication. Our JOLTS explainer ahead of the September release describes why a vacant position is not a payroll job. The September actual release provides a separate cross-check on willingness to recruit, not a reason to equate job postings with filled positions.
The Federal Reserve's October 28 policy statement said job gains had kept pace with the workforce and the unemployment rate had changed little, even while inflation remained elevated. It maintained a 3.75% to 4% target range for the federal funds rate. That combination rules out an automatic lower-rates inference from low claims. The statement was issued before the October 29 weekly release; it is evidence of the Fed's policy framing at that date, not a Fed reaction to the 194,000 number that came afterward.
There is also local texture that one national line misses. The Fed's October Beige Book summary said most Districts saw little or no net change in employment. Five Districts reported firms that had reduced staffing through attrition, delayed hiring or expected less job creation following productivity investments in artificial intelligence. These observations come from district contacts, not a nationally representative count of layoffs. They nevertheless explain how firms could hold the workers they already have while providing fewer openings for someone searching from outside.
Put the sources together and the disagreement is about the margin being measured, not about whether one agency is wrong. Initial claims are the inflow of new applications, continued claims a rough insured stock, JOLTS a monthly survey of vacancies and turnover, payrolls the net change in jobs, and the Beige Book a set of regional business contacts. The strongest reading today is that mass new benefit applications have stayed contained even as net hiring has been modest. The bear case is that subdued layoffs cannot protect job seekers indefinitely if openings or hires soften. The bull case is that stable retention may buy time for demand to recover without a sharp rise in unemployment.
What is dated next
The next scheduled weekly claims release is Thursday, November 5, at 8:30 a.m. Eastern. It will report initial applications for the week ended October 31, update the four-week average and revise the October 24 number if states submit new information. On November 4, neither the new initial figure nor any market consensus verified from a primary source is available for this story. A print above or below 194,000 would be measured against a revised prior week, not against the original number in isolation. The latest release and its archive are the primary place to check the actual once issued.
Friday, November 6, at 8:30 a.m. Eastern brings the October employment report, according to the BLS September release's next-publication notice. That monthly report should show payroll gains, unemployment and the revisions for previous months. If claims climb for several weeks and the payroll report also weakens, the case for a more material hiring slowdown would strengthen. If claims hold near the recent range while payrolls rebound, the retention story would have more support. A single Thursday print cannot settle either case; the dated sequence of observations can.
There is a third clock after that: BLS schedules October JOLTS for December 1 at 10 a.m. Eastern. The delayed vacancies and turnover data can test whether firms kept advertising and filling roles, or merely avoided laying people off. Until those releases arrive, 194,000 is the latest verified adjusted initial-claims actual for October 24. The next responsible update is not a guess at Thursday's number. It is the published October 31 count, its revised comparator and its four-week average, read together.
Frequently Asked Questions
What is the initial jobless claims actual this week?
As of November 4, the latest published US seasonally adjusted actual is 194,000 initial claims for the week ended October 24, 2026, in the Labor Department's October 29 release. The October 31 week is scheduled for release November 5. The unadjusted count for October 24 was 178,851, which is a different measure of the same reporting week.
What is the four-week average of jobless claims?
It is the average of four successive seasonally adjusted initial-claims readings. For the October 24 week it was 196,750, down from the prior revised average of 198,000, according to the weekly release. It smooths the noisy weekly series but can react more slowly when a real shift begins.
Why did unadjusted claims rise when the headline fell?
Raw applications rose by 5,648 to 178,851 in the October 24 week. The Labor Department says the seasonal factors had expected a rise of 6,040. Because the raw increase was smaller than usual for that week, the published seasonally adjusted headline fell by 1,000 to 194,000. The two measures answer different comparison questions.
Are continuing claims the same as the unemployment rate?
No. The latest seasonally adjusted continuing-claims reading was 1.701 million for October 17, and the insured unemployment rate was 1.1%, per the Labor Department. BLS's September unemployment rate was 4.2% in its household survey. They cover different people, definitions and reference periods.
When is the next jobless claims report?
The next weekly release is due Thursday, November 5, 2026, at 8:30 a.m. Eastern, covering initial claims for the week ended October 31. The latest Labor Department release is dated October 29; the subsequent report should also revise the previous week's count where needed. Compare the new actual, prior revision and four-week average before calling a change in the trend.
This content is for informational purposes only and does not constitute financial advice. Past performance is not indicative of future results. Consult a qualified financial advisor before making investment decisions.
Get daily intelligence delivered
Create a free account for the Daily Brief every weekday and The Week Ahead every Sunday. No card required.