Housing Starts Explained: August Fell Before September Data

Housing starts measure the number of privately owned homes where construction begins, not the number of homes sold or finished. The latest verified Census and HUD release available as of 10:05 UTC on October 20 is for August: 1.275 million units at a seasonally adjusted annual rate, down 2.6% from revised July. The September release is scheduled for 8:30 a.m. Eastern today. There is no September result to interpret yet. The question is whether apartment projects or single-family homes drive any change.
A start is one unit entering construction. It says little about when that unit will be available for occupancy, and it is not a count of contracts signed by buyers. The Census construction definitions separate authorizations, starts, homes under construction and completions because each answers a different question. Investors watching builders care about starts as a measure of work entering the pipeline. Households hoping for more homes to choose from care more about what eventually gets completed and offered in their location.
Rates are the other half of the story. Freddie Mac's October 15 survey puts the average 30-year fixed mortgage rate at 7.40%, compared with 6.27% a year before. For a $320,000 principal over 30 years, that difference raises calculated monthly principal and interest by about $241. It excludes taxes, insurance, mortgage insurance, points and maintenance; it is not a quote for any borrower. Our earlier look at mortgage-rate pressure explains why a buyer may see little relief even when the headline home price stalls.
How the construction pipeline got here
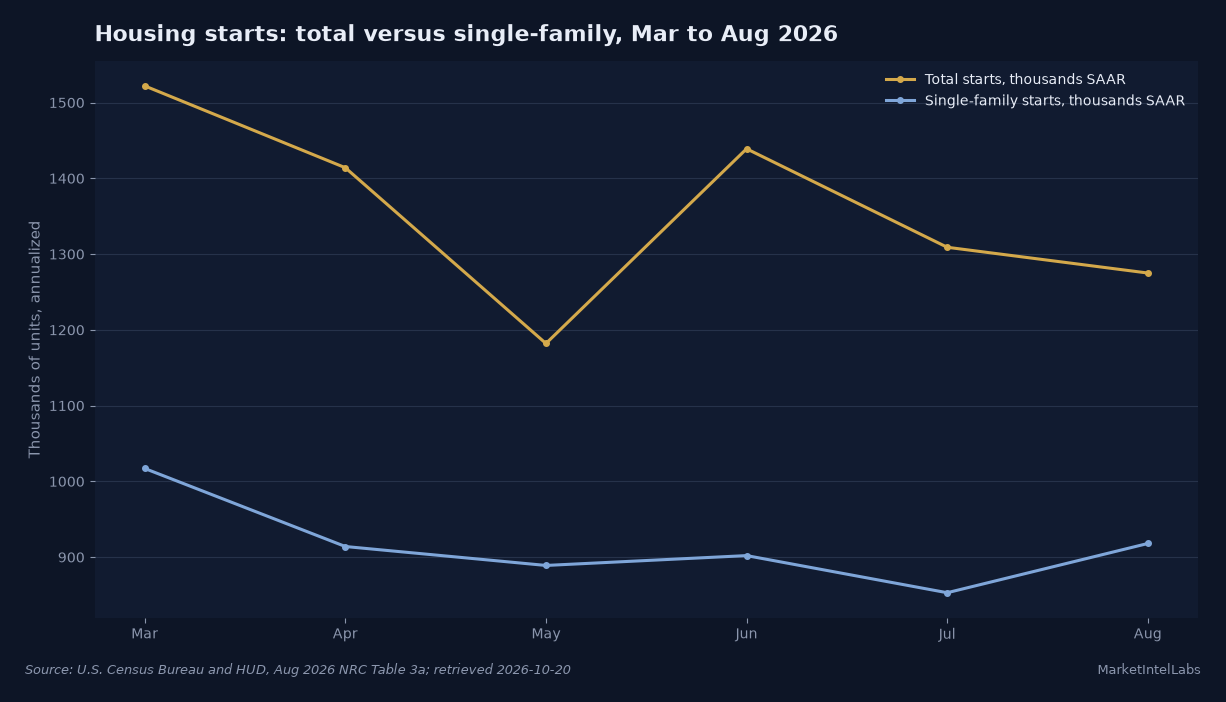
The August release shows why a national total can mislead. Census Table 3a reports total annualized starts of 1.522 million in March, 1.182 million in May, 1.439 million in June, 1.309 million in July and 1.275 million in August. That is a jagged series, not a straight descent. Census explicitly warns in the release's explanatory notes that it can take six months to establish an underlying trend in total starts. The latest month's headline, by itself, is a poor substitute for the entire run of figures and their revisions.
The mix changed even while the total slipped. In August, single-family starts were 918,000 at an annualized rate, up 7.6% from revised July's 853,000. Starts in buildings of five units or more were 344,000, compared with 444,000 in July, according to the same Census table. These are units, not buildings: one apartment project can add many units. A decline in multifamily projects can therefore outweigh more detached-house starts in the national total, while saying little about a buyer's options in a neighborhood dominated by single-family homes.
Look further back and the temptation to call any one month a turning point fades. The table reports 1.291 million total starts and 873,000 single-family starts in August 2025. August 2026's total of 1.275 million was 1.2% lower year over year, while its single-family figure was higher. Those two comparisons can both be true because the remaining types of construction moved differently. Even the year-over-year change in total starts is not statistically conclusive on the release's stated sampling measure. The housing market has several clocks, and the single national number blurs them.
Permits offer another clock. Census and HUD put August authorizations at 1.394 million units annualized, down 2.7% from revised July and 3.5% above August 2025. Single-family authorizations were 878,000, down 1.8% from July; authorizations for buildings with five units or more were 467,000. The difference between that 467,000 and the 344,000 multifamily units started in August is not a forecast of how many will start in September. Permits and starts are different statistical populations and stages; a permission to build does not force a shovel into the ground on a set date.
Completions were weaker in the same release: 1.128 million units at an annualized rate in August, 11.9% below revised July's 1.280 million and 27.1% below August 2025's 1.548 million. Single-family completions were 816,000. A finished dwelling is nearer to the point at which supply can affect availability than a newly started one, although it need not immediately appear as a listed home. The release's explanatory notes say the six-month caution applies to completions too. It is possible for starts to improve while completions weaken if work begun in earlier periods is clearing at a different pace.
Regional composition also limits the national headline. Census Table 3a puts August starts at 658,000 annualized units in the South, 323,000 in the West, 198,000 in the Midwest and 96,000 in the Northeast. The South accounts for much more of the total, so a change there can dominate the U.S. number. That does not mean an apartment renter in the Northeast sees southern projects as nearby supply. A national rate is useful for the industry's cycle; local availability depends on which units are delivered where, at what price and on what schedule.
What a housing start measures and why it matters
Census defines a start around the beginning of excavation for the foundation or footings. It is a construction milestone, not the sale date, closing date or move-in date. For a structure containing several apartments, the unit count can enter the starts measure when construction of the building begins. That design helps explain why a single large development can make a monthly multifamily series appear volatile. It also means readers should not translate a seasonally adjusted annual rate into actual homes started in one month.
A seasonally adjusted annual rate answers a hypothetical question: what would the yearly pace be if that month's seasonally adjusted activity persisted for twelve months? August's 1.275 million is not the actual August unit count. The Census methodology describes the collection, adjustment and estimation framework. Analysts use the annualized pace to compare months with different seasonal patterns. Readers planning a move should not confuse that comparable rate with available listings or with the not-seasonally-adjusted count of units built during the month.
A building permit is upstream from that milestone. The Census Building Permits Survey definitions describe authorizations reported by permit-issuing jurisdictions. That makes permits a measure of legal approval in covered places, not a guarantee of financing, labor or timely completion. A builder may have a permit and still wait for buyers, capital or contractors. Conversely, differences in local permitting practice complicate simple comparisons. Permits tend to be watched for prospective activity, but the path from authorized unit to finished home is neither automatic nor uniform.
The economic transmission runs through decisions made at each step. Builders assess whether a new project can sell or rent at a price that covers land, materials, labor and financing. Buyers assess the monthly payment. A high mortgage rate can narrow the pool able to afford a finished house even if the physical cost of construction has not changed. When that happens, a builder may reduce starts, offer concessions, shift product types or postpone a site. None of these choices is directly identified by the starts figure; the pipeline data show what happened, not the builder's private reasoning.
The affordability arithmetic clarifies the constraint without pretending to describe a typical transaction. Using Freddie Mac's 7.40% October 15 rate, a $320,000 principal amortized over 360 payments costs approximately $2,216 monthly in principal and interest. At the 6.27% rate Freddie Mac reports for the same week a year earlier, the calculation is about $1,974. These calculations hold the loan size constant and exclude every other carrying cost. They are an illustration of rate sensitivity, not a claim that all buyers borrow that amount or face the survey average.
There is a counterweight: more starts can eventually add supply, and a future reduction in financing costs could improve demand, but neither turns an August construction site into a ready-to-occupy house in October. Lower rates can even bring more buyers back before new supply is completed. That timing mismatch helps explain why a positive starts print does not automatically reduce current asking prices. Our report on October builder sentiment provides a separate read on builders' willingness to take that risk; a confidence survey and an official count of construction activity should not be treated as the same observation.
The other counterweight is weak activity. If builders pull back on new starts because demand is soft, there may be fewer homes delivered later. A weaker current construction figure may therefore point to a tighter future supply pipeline even while today's market feels slow. On the rental side, multifamily starts matter to eventual apartment supply, but the construction lag can be long and varies by project. These possibilities are reasons to compare permits, starts and completions rather than assign a single bullish or bearish label to a monthly release.
Our chart plots the Census Table 3a monthly rates for total and single-family starts through August. Total starts range from 1.182 million in May to 1.522 million in March; single-family starts range from 853,000 in July to 1.017 million in March. The September points are intentionally absent because the scheduled release has not yet landed. The shape matters more than a prediction drawn through the final dot. The gap between the two lines reflects units in other building types, not a count of unsold inventory.
What the primary documents actually establish
The release offers an unusually useful warning about precision. Its August total starts change of minus 2.6% from July has a 90% confidence interval of plus or minus 12.0 percentage points. The release marks that comparison with an asterisk because the interval includes zero. In plain language, the survey evidence is insufficient to conclude that the underlying month-to-month change was actually negative. The 7.6% reported increase in single-family starts also has a plus or minus 14.0 point interval. A headline that declares a proven single-family rebound would outrun the evidence.
That is not a claim that the published estimates are useless. They are official estimates with a measure of uncertainty. The methodology document explains why estimates from sampled construction observations can change when more information arrives. The August report identifies June and July as revised and August as preliminary. Revisions can reverse the apparent direction of a monthly comparison. Treat the earliest reading as provisional.
There is also a technical distinction in the release that matters to comparisons. Census says its permits table is based on a non-probability sample and is not assigned sampling error, though nonsampling error remains. Its starts and completions tables are survey estimates subject to sampling variability and other error. Comparing the headline percentage moves as if their confidence were identical is a mistake. The explanatory notes say preliminary seasonally adjusted estimates for total permits, starts and completions are revised by 3.8% or less on average; that is a historical description, not a cap on any individual revision.
The Survey of Construction definitions place the start inside a longer process that also records characteristics and completion. A start gives evidence of activity entering production; it does not prove a buyer has secured a mortgage or that a rental unit will be ready by a fixed deadline. That distinction matters particularly when comparing new construction with existing-home listings, which come from a different stock. The two measures can move in opposite directions for months without either source being wrong.
Freddie Mac's mortgage survey is another primary document, but it does not say how many borrowers received a particular rate. Its PMMS description says the weekly national average uses rates from purchase applications submitted through Loan Product Advisor, with a Thursday-to-Wednesday observation window. The 7.40% number is a weekly average, not a guaranteed offer for a borrower on October 20. Credit profile, loan type, points, loan size and lender terms can change the actual payment. The calculation above is intentionally framed as a constant-principal example.
Nor do permits and starts alone tell us whether this year's new homes are affordable to the households who need them. The official series counts units, without assigning them to income-qualified prospective buyers. More units in one region and price band may coexist with a shortage elsewhere. Our earlier analysis of regional home-value differences offers context for why national aggregates can conceal local divergence. For the September release, the disciplined approach is to check the geography and structure type as well as the U.S. headline.
A constructive reading would require more than one favorable data point. If September's single-family starts and permits both improve after revisions, and completions stabilize, the pipeline would look broader. A cautious reading would emerge if permits weaken while starts bounce, because the near-term activity could be drawing on an earlier stock of authorizations rather than adding a sustained stream of projects. Neither scenario is a forecast: it specifies what evidence would make the interpretation stronger or weaker once the official numbers exist.
What is dated next
Census schedules the September New Residential Construction release for October 20 at 8:30 a.m. Eastern. This article was prepared before that publication. Its references to August are dated and must not be read as a report of September results. When the tables are published, compare September with the newly revised August and July rates, then read Table 3a by structure type. If the official release has not appeared at the scheduled time, the correct response is to wait rather than fill a blank with an estimate.
The same schedule lists October 27 for September New Residential Sales and revised building permits, with revised permits scheduled for 8:00 a.m. Eastern and sales for 10:00 a.m. Eastern. October New Residential Construction is listed for November 18 at 8:30 a.m. Eastern. These dates allow a sequence of checks: the first September construction estimate, later permit revisions and new-home sales, then another month of construction activity. Dates can change, so check the linked Census schedule before relying on a future print.
Watch three comparisons after the September data arrive. First, does the single-family series move with the total, or does multifamily again dominate? Second, do permits point in the same direction as starts, with the caveat that they are not a mechanical forecast? Third, are previous months revised enough to change the narrative? A fourth check is the mortgage-rate backdrop: Freddie Mac's next weekly survey will describe a different period from the one measured by September starts. Aligning the clocks is more informative than matching two headlines published on the same day.
For households, supply and affordability remain linked. A higher start rate can mean more potential choices later, not cheaper homes this morning. A lower rate can mean fewer future completions, not necessarily that today's sellers have regained pricing power. August's official release shows a softer total, a firmer single-family component and weaker completions, all with stated limitations. September may sharpen or overturn that picture. The number to watch is not merely the new headline total, but whether the underlying pipeline becomes more coherent across permits, starts and completed units.
Frequently Asked Questions
What are housing starts?
Housing starts count privately owned housing units where construction has begun. The Census definition ties the milestone to foundation work. A start is not a sale, a listing or a completed home. For multifamily buildings, the release counts housing units, not simply the number of structures.
What does the housing starts annual rate mean?
The seasonally adjusted annual rate expresses one month's adjusted pace as a hypothetical yearlong pace. August's 1.275 million does not mean that many homes were started during August. It makes monthly comparisons easier when construction normally varies by season; it is not a promise that the same pace will continue.
What is the difference between housing starts and building permits?
Permits indicate authorizations to build in permit-issuing places, while starts mark construction actually beginning. The Census permits definitions and construction definitions refer to different stages. A project can receive permission and start later, be delayed or not proceed at all. Do not subtract one month's starts from its permits and call the difference future homes.
When does the September 2026 housing starts report come out?
The Census Survey of Construction schedule lists September New Residential Construction for October 20, 2026, at 8:30 a.m. Eastern. As of this article's pre-release preparation, the latest verified construction release was August. Consult the official release and tables for September's actual result.
Do more housing starts mean house prices will fall?
Not necessarily. Starts are an early production milestone, and completed units arrive later and in particular markets. Prices also depend on demand, financing costs and the type of home delivered. An increase in one region or in multifamily units may not expand the choices facing a buyer elsewhere. Read the official permits, starts and completions tables together before drawing a supply conclusion.
This content is for informational purposes only and does not constitute financial advice. Past performance is not indicative of future results. Consult a qualified financial advisor before making investment decisions.
Get daily intelligence delivered
Create a free account for the Daily Brief every weekday and The Week Ahead every Sunday. No card required.