Housing Week: More Listings, But Buyers Still Face a Payment Wall


The U.S. housing market is loosening at the edges, not breaking open. Existing-home inventory crossed 1.6 million in August for the first time since 2019, but resale activity fell below a 4-million annual pace as mortgage costs rose. New construction offered a mixed signal: single-family starts rebounded, while builder confidence slipped and discounts spread. For households, the key question is not simply whether rates move lower; it is whether added choice and builder incentives can outpace the cost of financing.
This week's releases are largely a look back at August and September. The next broad test arrives later in October, when September construction and resale data are scheduled.
Inventory is improving, turnover is not
The National Association of Realtors reported that existing-home sales declined 2.0% in August to a seasonally adjusted annual rate of 3.98 million, the lowest pace since June 2025. That is a meaningful reminder that more homes on the market do not automatically translate into more completed sales. Closings reflect contracts agreed weeks earlier, and buyers remain sensitive to monthly payments and the total cost of ownership.
Supply nevertheless moved in a more constructive direction. Inventory rose 3.2% from July and 5.9% from a year earlier to 1.62 million homes; available supply reached 4.9 months, versus 4.6 months in both July and August 2025. The level is not a glut, but it gives buyers more scope to compare properties and negotiate than during the exceptionally tight years after 2020. Median time on market lengthened to 31 days from 29 in July, another small sign that sellers are meeting a more selective market.
Prices remain sticky. The national median existing-home price was $429,100, up 1.6% year over year and extending the annual increase streak to 38 months. That is not evidence that every home or metro is appreciating: regional results varied.
The West's median slipped 0.2% from a year earlier to $619,100, while the Northeast rose 4.3% to $556,900. The South, the largest region by sales, had a 0.7% gain to $366,500. A national median can also move with the mix of homes sold, so it should not be read as a same-home price index.
Financing is the affordability constraint
Freddie Mac's Primary Mortgage Market Survey put the average 30-year fixed rate at 6.95% on September 17, up from 6.76% a week earlier and 6.67% in August. It was also above 6.34% on October 2, 2025. These weekly averages are market benchmarks, not a quote for an individual borrower; actual offers vary with credit, down payment, loan type, points and lender.
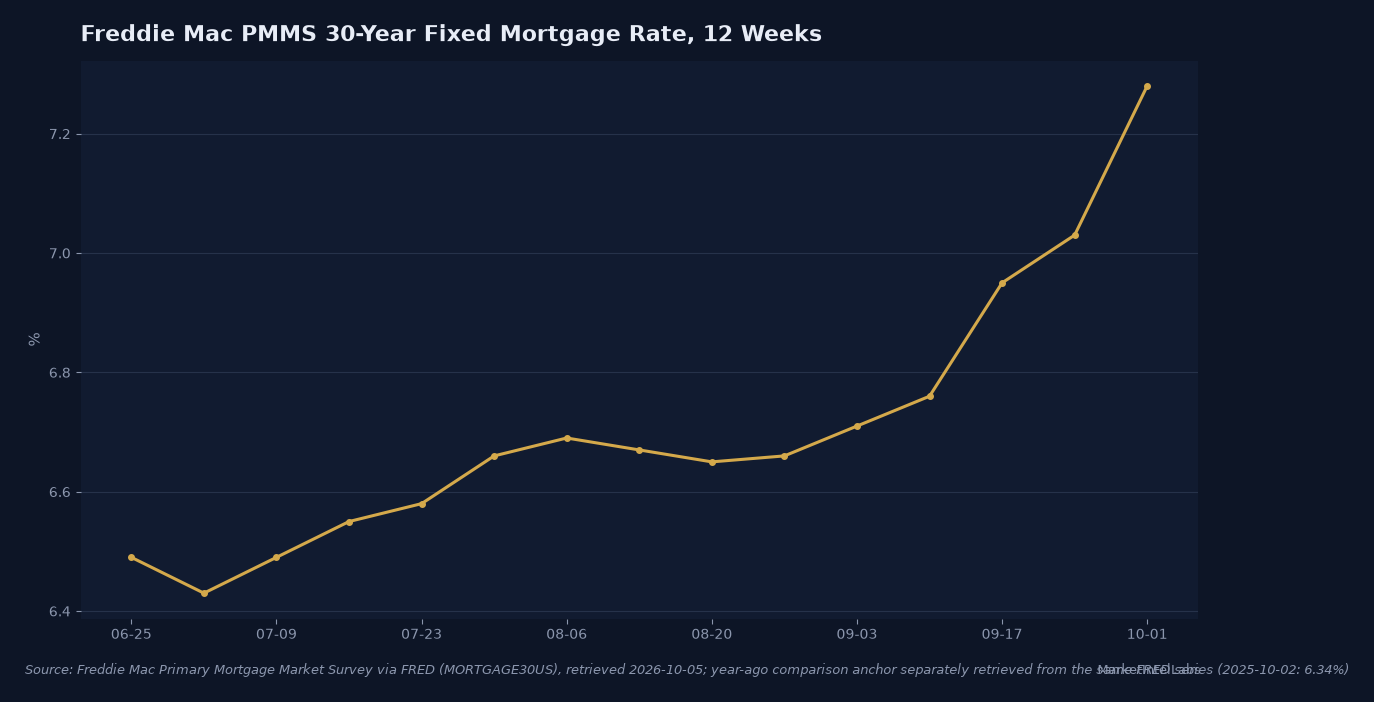
The payment arithmetic shows why that rate change matters. On a $429,100 home with 20% down, a 30-year fixed loan would be $343,280 before closing costs. At 6.95%, principal and interest are about $2,270 a month; at 6.34%, about $2,135, a difference near $135 monthly. This illustration excludes property tax, insurance, maintenance, association dues and mortgage insurance if applicable. It is not a borrowing recommendation. Higher rates can erase the near-term benefit of more listings, especially for first-time buyers with limited cash reserves.
There is a counterpoint: NAR's Housing Affordability Index increased to 104.7 from 101.2 a year earlier, with year-over-year improvement across all four regions. Index gains indicate a better relationship between median family income and mortgage costs under NAR's methodology, not that housing is affordable for every household. The fact that only 30% of August buyers were first-timers, though slightly higher than 28% a year earlier, underscores the unevenness of access.
Builders are discounting, cautiously
New supply may offer a route around the resale lock-in effect, but the signals are mixed. The Census Bureau and HUD estimated August housing starts at a 1.275-million annual rate, compared with 1.309 million in July. Single-family starts rose 7.6% to 918,000 and were 5.2% above a year earlier, while multifamily starts fell 21.7% to 357,000. Total permits eased to 1.403 million; single-family permits were down 1.8% from July to an 878,000 pace, a forward-looking caution against extrapolating the starts rebound.
The NAHB/Wells Fargo Housing Market Index fell three points to 32 in September, below the 50 threshold that separates more positive from more negative builder views. The current-sales component fell to 35, six-month expectations to 37, and buyer traffic stayed at 23. Builders are adjusting the offer: 38% cut prices in September, with an average reduction of 6%, and 66% offered sales incentives, up from 63% in August. Incentives can make a new home more competitive, but their value depends on the buyer's eligibility and the contract terms; they do not remove taxes, insurance or the risk of a future reset in costs.
Watch the October calendar
The next published data will help distinguish a short pause from a deeper cooling. NAR has September existing-home sales set for October 13 and its Pending Home Sales Index for October 20. Census schedules September residential construction for October 20 and new-home sales for October 27. Pending sales track signed contracts, so they can provide a timely demand signal ahead of closings, while permits and starts indicate builders' willingness to add supply.
A constructive case is taking shape through rising resale inventory, better affordability readings and builder incentives; a weaker case is visible in the sub-4-million resale pace, higher financing costs and subdued builder confidence. Neither guarantees a price reversal or a swift recovery. The clearest near-term signal will be whether contract activity improves without mortgage costs retreating, and whether more choice translates into slower price growth rather than simply longer selling times.
This content is for informational purposes only and does not constitute financial advice. Past performance is not indicative of future results. Consult a qualified financial advisor before making investment decisions.
Get daily intelligence delivered
Create a free account for the Daily Brief every weekday and The Week Ahead every Sunday. No card required.