Gold price sits 26% below its record, but central banks and a $5,013 forecast say the pullback is a base

Gold is about 26% below the record it set in January, and the argument over whether that is a deep pullback inside a bull market or the start of a real breakdown comes down to who is buying on the way down. Central banks are still buying, and the people who make the annual LBMA gold forecast still see prices near $5,013 twelve months out. December gold futures were changing hands near $4,162.80 Wednesday, down 0.58%, with spot around $4,138.34.
Start with the obvious headwind, because it is real. The Federal Reserve hiked in September to a 3.75%-4.00% target, and markets price roughly 87% odds of another hike by December.
Related reading: Central Banks Bought a Record 289 Tonnes of Gold in Q2.
Higher-for-longer rates lift the dollar and the opportunity cost of holding a metal that pays nothing, and that is the most direct explanation for why gold sits roughly $1,455 below where it peaked. That peak, a $5,594.82 print in January, came during a stretch of peak geopolitical de-risking and rate-cut pricing that has since fully reversed.
The bull case for calling this a base rather than a breakdown rests on who keeps buying. The World Gold Council reported that central banks added a net 39 tonnes in August, with China chipping in around 20 tonnes, extending a run that has put an explicit floor under the market for two years. This is structural demand from institutions that do not care about the next FOMC meeting.
For the broader framework, see our gold coverage.
Related reading: Gold Holds Near $4,400 as Central Banks Absorb Supply.
The LBMA delegate forecast, which sits near $5,013 on a twelve-month view, reflects the same reasoning. Sellers have dominated paper flows for months, yet the physical bid has absorbed every dip.
History is on the side of patience here. Gold corrected roughly this magnitude in 2011-2013, and support only stabilized after the rate path stopped climbing. That tells you what to watch rather than where to guess a bottom. If the Fed reaches the end of its hike cycle and gold is still holding the low $4,100s, the correction is doing exactly what corrections inside a longer bull path do.
Related reading: Gold at $4,390: Record Central Bank Buying and Hedge Fund Positioning Signal Structural Shift.
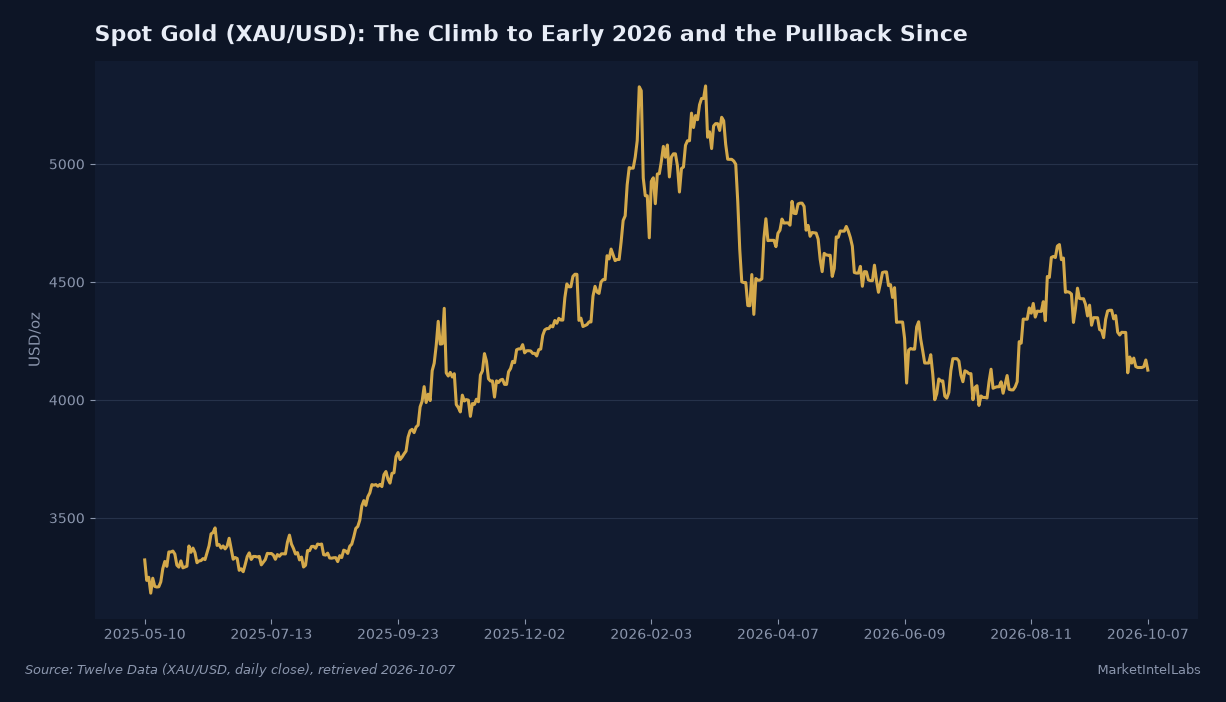
The congestion zone to track is the $4,100-$4,200 band. A hawkish set of FOMC minutes that signals broad agreement on several more hikes could push spot through $4,100 and toward $4,050, which would damage the base thesis. That is the tail risk, and it is worth naming plainly.
Silver gave the most useful signal of the week. It surged 1.45% to $61.75 on October 6, the largest single-day gain among tracked commodities, with December futures near $61.05. The trigger was a softer dollar plus record Chinese solar manufacturing output, a fundamental that has nothing to do with the Fed.
Related reading: Gold Holds Above $4,400 as Central Bank Buying Provides Support.
Silver carries higher beta than gold, so it over-undershoots the metal on both sides. It is down far more than gold from its record, a $121.30 52-week high versus roughly $61 today, and it should respond hardest if the dollar rolls over. Scotiabank's $65 target for 2027 points the same direction: industrial demand on top of the precious-metals bid.
The near-term catalysts are now scheduled and close. FOMC minutes from the September 15-16 meeting release Wednesday at 18:00 UTC, and the read will be whether the committee treated the September hike as one-off insurance or as the start of a longer tightening path. That distinction matters more than the hike itself, because the market has already priced most of it.
The September CPI print follows next week, and it is a preview, not a result, until the Bureau of Labor Statistics releases it. Elevated inflation is what justified the September hike, so a hot number supports the hawkish line, while a soft one opens the door to October-hike odds falling.
The read here is straightforward. There is a real base forming under gold, built by central banks and anchored by the LBMA forecast, and it has been absorbing every down-leg for two years. The price is not going back to January levels this week.
But the shape of the setup, a deep correction inside a bull path with the physical bid holding and the main threat tied to how many more hikes the Fed delivers, is the kind of market where the base holds longer than the impatient sellers expect. Watch the FOMC minutes for how many hikes, watch September CPI for whether the data agrees, and watch the $4,100-$4,200 band for whether the base survives contact with either one.
This content is for informational purposes only and does not constitute financial advice. Past performance is not indicative of future results. Consult a qualified financial advisor before making investment decisions.
Get daily intelligence delivered
Create a free account for the Daily Brief every weekday and The Week Ahead every Sunday. No card required.