Drewry Container Index Explained: Why Routes Diverge


The Drewry container index is a weekly measure of agreed spot ocean freight rates, expressed in US dollars per 40-foot container. Its World Container Index (WCI) stood at $4,429 on October 29, 2026, down 3% from October 22, according to Drewry's published route table. That figure is an eight-route, volume-weighted composite, not the price to ship a box on every lane. Shanghai to Los Angeles was $7,514, while Shanghai to Rotterdam was $3,686. The gap tells a shipper more than the composite alone.
The index is useful because it puts a dated price on moving goods across specific sea lanes. It is not a retail inflation index, a universal shipping invoice or a quote for a container you can book today. Readers looking for the immediate October 29 rate reaction can see our report on the composite's 3% decline. This feature explains how the benchmark is assembled and why a fall on one major route can coexist with a rise on another.
Related reading: Shanghai to New York Freight Rose 7% to $10,428 as WCI Fell 1%.
The answer for a buyer of imported goods is conditional: a lower spot benchmark can reduce the ocean component of future landed costs, but the saving depends on the buyer's contract, the sailing date and other charges. For a carrier, the same falling rate may narrow revenue per box even if ships remain full. A weekly composite by itself cannot settle either margin question.
How the rate map reached this point
On October 15 the WCI composite was $4,485. It rose to $4,585 on October 22, then fell to $4,429 on October 29, according to the three dated columns in Drewry's WCI assessment. Those are weekly observations, not a daily trading path. A chart connecting them shows the short sequence; it cannot establish the exact day on which rates changed between assessments.
Related reading: Drewry’s Intra-Asia Index Sets a Sixth Record at $1,518.
The route split is the point. Shanghai to Los Angeles went from $7,884 on October 15 to $8,007 on October 22, then $7,514 on October 29. Shanghai to New York followed a similar last-week decline, from $10,166 to $9,631. In the same October 22 to October 29 interval, Shanghai to Rotterdam increased from $3,632 to $3,686, and Shanghai to Genoa was nearly unchanged at $4,151. One global headline would conceal the direction of the Europe lane.
Drewry attributes the latest composite decline mainly to trans-Pacific weakness. Its commentary says six blank sailings had been announced for the following week on that trade, versus five in the current week. That is an announced schedule at the time of the assessment, not verified canceled departures. It also says four blank sailings had been announced for the following week on Asia to Europe, down from eight. Less withheld capacity on that lane could make a planned November rate increase harder to sustain, but neither announcement proves the rates carriers will collect.
The demand side carries a timing trap. In an October 8 Global Port Tracker release, the National Retail Federation and Hackett Associates forecast 2.25 million twenty-foot equivalent units, or TEU, of US imports in October and 2 million in November. The implied month-to-month drop is about 11%, but both figures are forecasts as of that release. NRF said August's 2.3 million TEU was the most recent final number in its covered-port series at the time. Neither projection should be described as October or November cargo already counted.
A later port-specific observation can tell a different story without invalidating the forecast. The Port of Los Angeles historical table lists 545,695.60 loaded import TEU in September and 500,301.50 in August. Those counts cover one port, loaded imports only; NRF covers multiple ports and reports a different aggregate. A stronger September at Los Angeles does not prove November demand will stay strong across all US gateways. It does show why an analyst should not infer a national demand collapse from a single weekly shipping price.
Our earlier comparison of trans-Pacific and European rates provides the background for that split. The useful update here is methodological: a rate can fall because freight demand cools, effective vessel supply grows or carriers change their pricing, and the publicly available weekly series alone cannot apportion the causes. Route schedules and physical port counts help test competing explanations.
How Drewry builds a container index
The WCI methodology published by Drewry defines eight route-specific indices and one composite. The lanes are Shanghai to Rotterdam, Rotterdam to Shanghai, Shanghai to Genoa, Shanghai to Los Angeles, Los Angeles to Shanghai, Shanghai to New York, New York to Rotterdam and Rotterdam to New York. Direction is part of the identifier. Shipping an export box westbound and repositioning a box eastbound do not command the same price.
The reporting unit is a forty-foot equivalent unit, or FEU, for a standard dry freight container carrying freight-all-kinds cargo. The method excludes refrigerated shipments and specialized boxes. It collects rates on which cargo is moving or expected to move under agreements between shipping lines and shippers or freight forwarders; offers and quotes that have not become agreed rates are excluded. The assessments have a stated validity of at least seven calendar days and at most one calendar month from the reporting date.
The sample comes from freight forwarders and non-vessel-operating common carriers based in Europe, North America and Asia. Their identities are confidential. Drewry describes a sequence in which the median submitted rate is found for a route, observations more than 30% above or below that median are discarded, accepted rates are averaged by carrier and those carrier averages are averaged into the final route rate. The methodology says only the final index is published, not the individual submissions. That protects confidentiality but means outside readers cannot independently reconstruct the route price from transaction-level records.
The composite weights those eight route indices by annual route trade volume, expressed in millions of TEU in Drewry's methodology. It is therefore not a simple arithmetic average of the eight numbers on the page. A jump in a high-volume lane can affect the composite differently from an equal-dollar jump in a smaller lane. Without the applicable weight table in the working calculation, a reader should not multiply eight public rates and claim to have replicated the published $4,429.
Coverage matters as much as arithmetic. Drewry specifies container-yard to container-yard ocean freight and no inland intermodal transport. Its stated ocean freight definition includes the bunker adjustment factor and applicable surcharges, with terminal handling included where that is common market practice. Documentation, booking and customs clearance fees are excluded. A landed cost model needs to add the charges the benchmark leaves out, as well as inland transport, financing, duties and insurance where applicable. Comparing an all-in invoice with the WCI as if they had identical coverage invites a false discrepancy.
Spot and contract prices also answer different questions. The WCI measures the assessed spot market on the named lanes; it does not say what a large retailer with an annual service agreement pays under that contract. Freight buyers may use the benchmark to test a new quote or an index-linked clause, but their own cargo mix, minimum volume, origin terminal and sailing week change the actual bill. Even a correct spot index is a reference, not a substitute for the invoice.
Two directions on the same pair of ports illustrate why the unit matters. Drewry's October 29 table has Shanghai to Los Angeles at $7,514 per FEU and Los Angeles to Shanghai at $837. That is a difference in assessed freight rates on opposite routes, not evidence that someone can ship either direction for a single global average. The return leg's cargo demand and equipment flows can differ from the import leg; the index describes prices, not a complete accounting of how many empty boxes move.
The chart shows divergence, not a universal rate
The original chart below plots four lines from the same three dated WCI columns: the composite and three outbound Shanghai routes. The Shanghai to Los Angeles line lost $493 from October 22 to October 29 while Shanghai to Rotterdam gained $54, using Drewry's reported figures. The plot uses the published dollar levels, not rebased percentages; a line at $10,000 represents a higher ocean rate than a line at $4,000. It has only three observations, so it should not be mistaken for a longer cycle or a smooth daily trajectory.
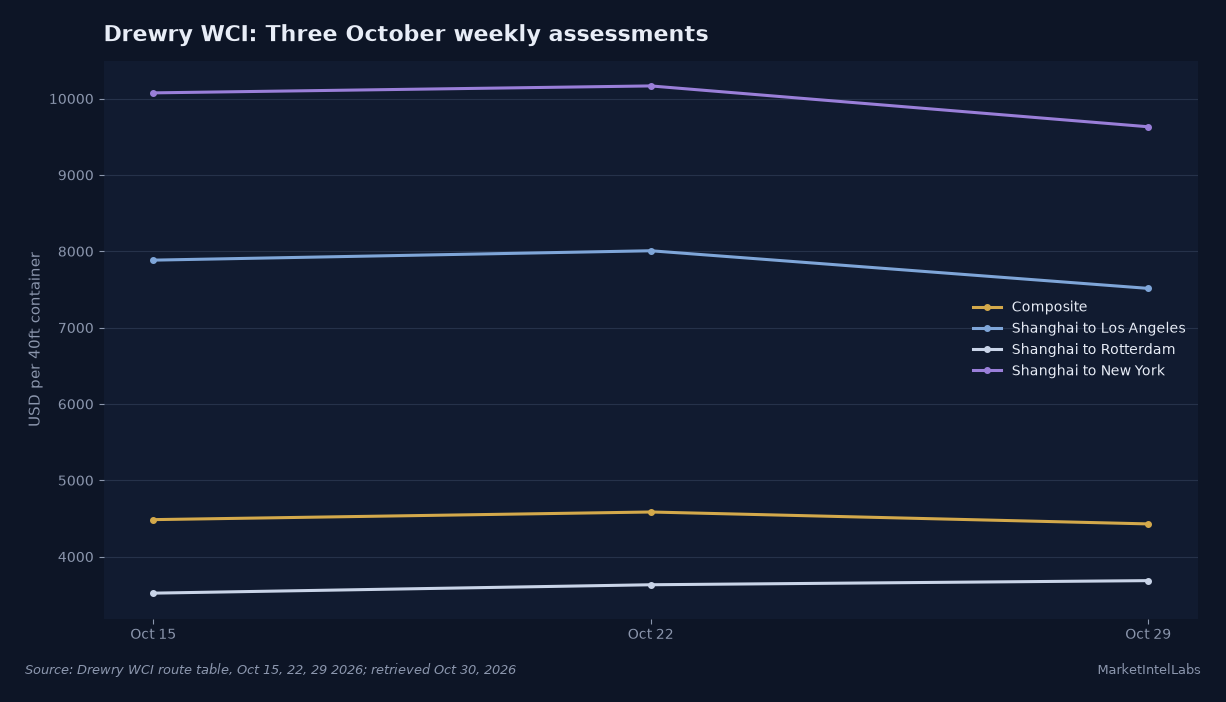
The chart also answers a recurring reader question about why the headline composite barely resembles a trans-Pacific invoice. The eight weighted directions include lower-priced return routes. October 29's Los Angeles to Shanghai assessment was $837, and Rotterdam to Shanghai was $646, according to Drewry's table. A $4,429 weighted global figure cannot be substituted for $7,514 Shanghai to Los Angeles any more than an average air fare can price a specific flight.
The regional comparison has a second limit. Drewry's Intra-Asia Container Index page describes a separate benchmark covering 18 route-specific indices and a composite, also in dollars per 40-foot container. The accessible page shows an IACI composite of $1,504 and cites Shanghai to Singapore at $1,889, but its displayed commentary does not clearly date those particular figures in the retrieved text. We therefore do not plot them against the explicitly dated October 29 WCI observations or call them simultaneous. An intra-Asia lane is not one of the WCI's eight routes. A search for the Drewry container index can land on either product, and the route list resolves which one a reader needs.
Drewry also says its IACI rates exclude origin and destination terminal handling charges. That differs from the WCI's conditional inclusion of terminal handling where common market practice calls for it. The two headline rates cannot be read as apples-to-apples door-to-door costs. For a buyer modeling a sequence of regional and transoceanic shipments, each leg needs its own benchmark and a charge reconciliation before the figures can be added.
What the primary documents support
Drewry expects trans-Pacific rates to decline in the week following its October 29 assessment. Its reasoning pairs easing US import demand with still-tight scheduled capacity from blank sailings. For Asia to Europe it expects broadly stable rates, and says November general cargo rate increases announced by carriers might not hold given available capacity and weak demand. These are Drewry's forecasts, not the next index print. The indicator to test them is the next dated route assessment, especially whether Shanghai to Los Angeles continues below $7,514 while Shanghai to Rotterdam stays near $3,686.
NRF's port forecast supplies a demand scenario, not a freight quote. Its October 8 release described an extended peak season that appeared to be ending. It projected October import volumes of 2.25 million TEU and November volumes of 2 million across the ports it tracks. A seasonal slowdown would weaken a shipper's need for last-minute spot capacity, but the link from a national TEU forecast to an individual Shanghai departure is indirect. Changes in ship availability, blank sailings and port handling can offset the volume effect.
The Los Angeles table provides a useful check on the chronology. September's 545,695.60 loaded import TEU exceeded August's 500,301.50 at that port, even as the October 29 WCI reading moved down. This is not a contradiction: port throughput records boxes handled after bookings and vessel transit, while a spot freight assessment records an agreed rate within its validity window. Price can move ahead of throughput, and a single port can diverge from the multiport national view. A reader who aligns these as if they are the same week's transactions will infer causation the documents do not demonstrate.
There is a constructive case for lower freight costs. If the coming weekly WCI readings show persistent declines across both US-bound routes while port volumes ease toward NRF's forecast, an importer renewing exposed spot shipments might face less ocean freight pressure. The skeptical case is that capacity management or a disruption reverses the spot rate before most cargo is booked, while contract customers never received the peak spot quote in the first place. Neither case authorizes a forecast for consumer prices from this index alone.
Other disruptions need careful attribution. Drewry's October 29 commentary reports an increase in Suez Canal transits and continued disruption around the Strait of Hormuz, but those maritime descriptions are Drewry's assessment rather than an independently confirmed voyage-by-voyage tally in this article. We are not assigning a specific dollar amount of the WCI to either route issue. If a charge changes, a shipper needs to inspect the surcharge and routing on the applicable lane rather than treat every global risk headline as an equal cost for every box.
One operational way to read subsequent releases is to compare like with like: the same origin-destination pair, direction, dry-box FEU unit and weekly assessment dates. Then check whether capacity announcements actually translate into sailings and whether final import TEU counts match the earlier projections. The order matters. Start with the price, test the explanation against an independently published physical series, and keep forecast and final observation in separate columns.
What is dated next
Because Drewry says the WCI is updated weekly, the next release after the Thursday, October 29 assessment is the week beginning November 2; check Drewry's live page for the actual publication and timestamp rather than assume a value or guarantee a specific release hour. A second decline on Shanghai to Los Angeles would support the short-term easing interpretation. A rebound would challenge it, particularly if the announced blank sailings restrict capacity more than demand slows.
November also tests the demand forecast. NRF's October 8 report put November US port imports at 2 million TEU versus its October forecast of 2.25 million, but the publication of final port data trails the month in which the goods move. Watch the Port of Los Angeles monthly loaded-import table and NRF's next tracker update for final versus projected figures; do not rewrite a projection as a completed print. On Asia to Europe, compare the next Shanghai to Rotterdam rate with October 29's $3,686 to see whether announced higher November rates turn into assessed agreements.
The useful question is not whether the composite goes up or down by itself. It is whether the route that delivers a buyer's goods changes, whether that buyer actually purchases at spot prices, and whether the next final cargo counts confirm the expected demand slowdown. Until those align, $4,429 is a precise benchmark for a defined basket on October 29, not a verdict on every retailer's costs.
Frequently Asked Questions
What is the Drewry container index?
The Drewry World Container Index is a weekly benchmark of agreed spot ocean freight rates on eight east-west shipping routes, reported in US dollars per standard 40-foot dry container. Its composite is weighted by annual route trade volume. Drewry also publishes a separate Intra-Asia Container Index for regional routes, so the index name alone does not specify the lane.
How much is the Drewry World Container Index today?
Drewry's latest explicitly dated WCI assessment retrieved for this article was $4,429 per 40-foot container on Thursday, October 29, 2026, down 3% from October 22. It is a composite, not a booking quote; Shanghai to Los Angeles was $7,514 in the same assessment. Readers checking after October 29 should use Drewry's live page for a newer print.
How is the Drewry World Container Index calculated?
Drewry collects agreed spot rates from freight intermediaries, removes submitted route prices more than 30% from the median, averages accepted prices for each monitored carrier, then averages carrier figures for the route rate. It weights eight route indices by trade volume for the composite. The source does not publish individual contributors' rates.
Does the Drewry index include port and inland charges?
Drewry's WCI is a container-yard to container-yard ocean freight measure. It includes stated ocean surcharges and terminal handling where market practice includes that charge, but excludes inland intermodal transport, documentation, booking and customs clearance fees. Drewry's separate Intra-Asia benchmark explicitly excludes origin and destination terminal handling charges, so the two series have different cost boundaries.
Why can container rates fall while port imports rise?
A weekly spot freight price reflects agreements and available shipping capacity, while port data count boxes after they arrive. Different dates, lane mixes and geographic coverage can yield different directions. In the documents reviewed here, the Port of Los Angeles counted more loaded imports in September than August, while Drewry's WCI fell between October 22 and October 29; those observations do not describe the same transactions.
This content is for informational purposes only and does not constitute financial advice. Past performance is not indicative of future results. Consult a qualified financial advisor before making investment decisions.
Get daily intelligence delivered
Create a free account for the Daily Brief every weekday and The Week Ahead every Sunday. No card required.