Shanghai to New York Freight Rose 7% to $10,428 as WCI Fell 1%


The global index fell, but importers are not all seeing lower costs. Drewry’s October 1 data show the gap: the global container composite fell 1% to $4,434, while Shanghai to New York rose to $10,428 per 40-foot container, its highest of the four weekly prints shown. Shanghai to Los Angeles was $7,835, little changed from $7,838 a week earlier. Golden Week factory closures in China temporarily reduced export volumes as carriers adjusted sailings. At the same time, US manufacturers reported stronger orders and higher input costs. For supply-chain managers, this is a route-specific signal rather than a simple easing story. Figure 1 tracks the divergence: US-bound rates were substantially above the global composite while Shanghai-Europe and composite eased.
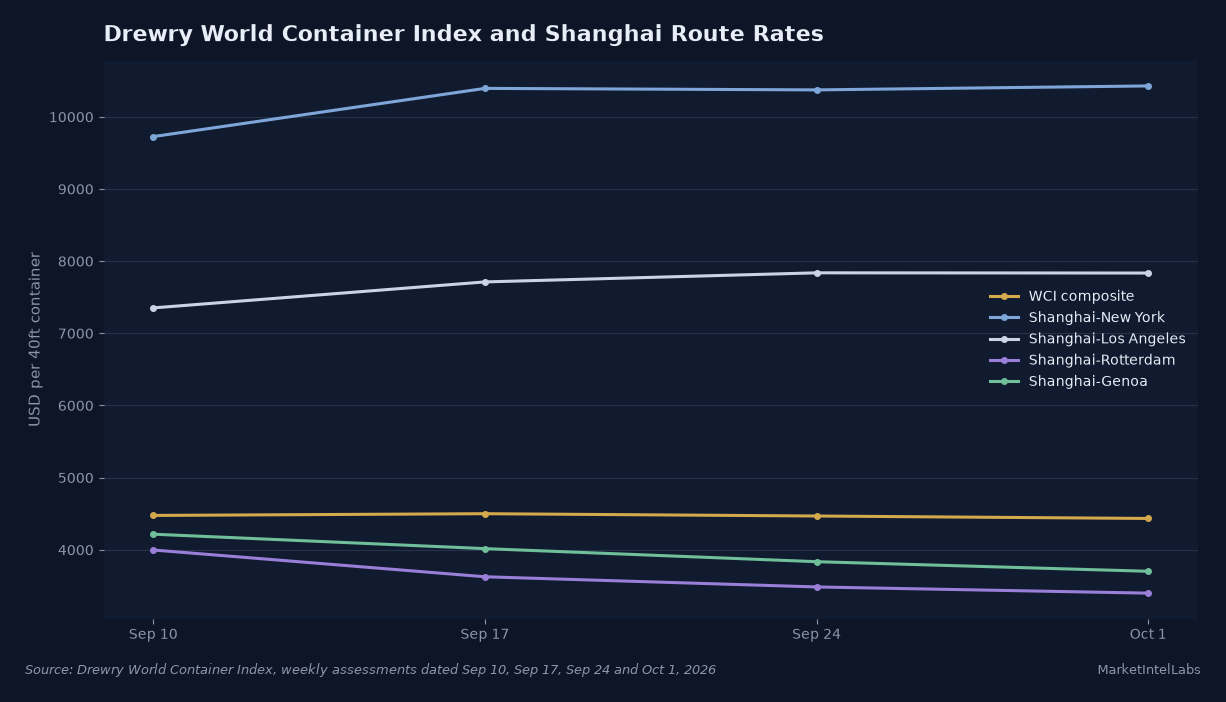
No single spot quote represents what every importer pays. A global composite is useful for direction, but lanes vary and contract terms can lag daily or weekly movements. From September 10 to October 1, Shanghai to New York rose about 7%, while Shanghai to Los Angeles gained about 7%. Fuel surcharges, destination handling, equipment and booking date also change the landed cost; the public index does not disclose an individual shipper’s rate.
On October 1, Shanghai to New York rose 1% from September 24, while Los Angeles was virtually unchanged. The global composite declined 1% to $4,434 per forty-foot equivalent. It is a weighted figure, not a lane quote. Shippers booking into New York should not assume it lowers their invoice.
Drewry described demand as resilient. It counted 10 blank sailings announced for the following week, down from 13. Chinese factories were shut for Golden Week. Drewry expects rates to fall next week as cargo supply declines and capacity increases. That remains a forecast. Carriers seek higher rates in the second half of October, though implementation is uncertain.
Asia-Europe rates are softer. On October 1, Shanghai to Genoa was $3,702 per FEU, down 3%, and Shanghai to Rotterdam was $3,399, down 2%. Drewry said rates had fallen for 12 straight weeks. Drewry reported Suez Canal transits in week 39 were 68% higher than a year earlier, adding effective capacity. Security conditions and Hormuz operations could still affect schedules. More capacity does not ensure every diverted shipment arrives without delay.
ISM shows orders and costs diverge
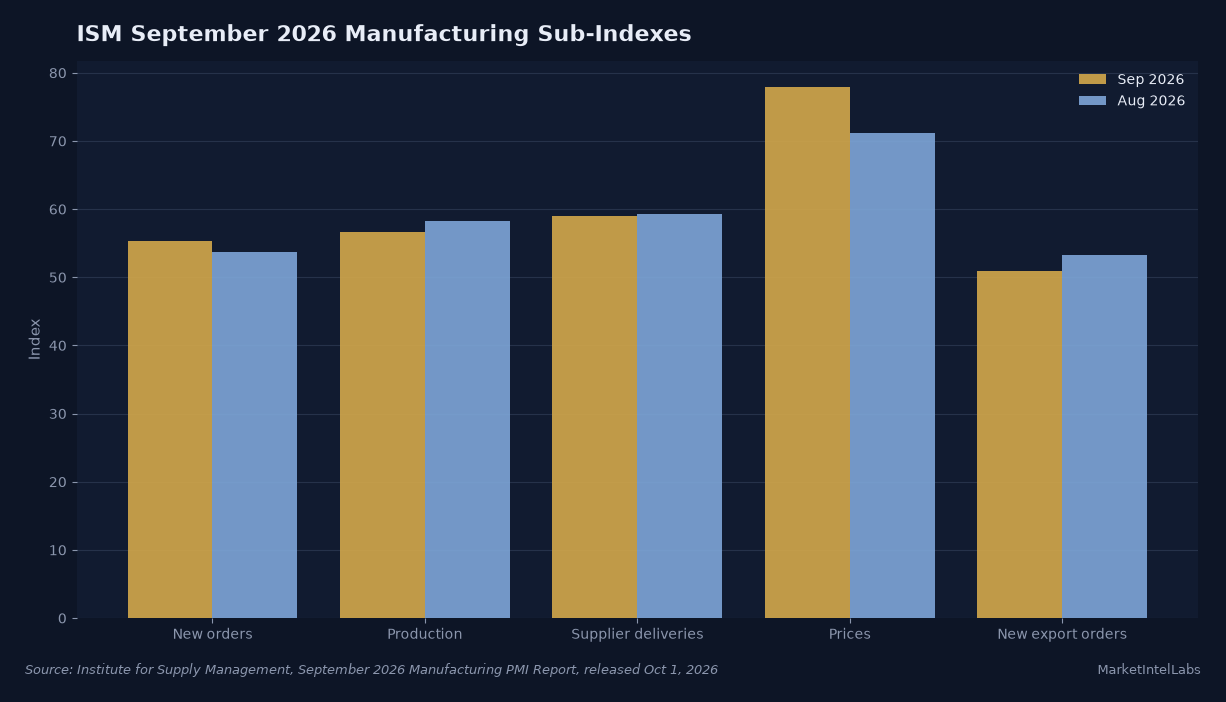
The Institute for Supply Management’s September manufacturing report, released October 1, put the PMI at 54.5, down slightly from August’s 54.6. That made nine straight months of expansion. New orders rose to 55.3 from 53.7. Production eased to 56.7 from 58.3, but stayed in expansion. Supplier deliveries registered 59.0, pointing to slower deliveries for a tenth month. ISM readings above 50 indicate expansion, not an equivalent percentage rise in output.
Costs are the pressure point. ISM’s prices index climbed 6.8 points to 77.9, its highest since May 2022. Respondents cited costs linked to the prolonged Iran conflict and tariff uncertainty. New export orders cooled to 50.9 from 53.2, near the expansion-contraction line. Figure 2 compares September with August: prices rose to 77.9, while new export orders eased to 50.9 and new orders rose to 55.3. Domestic demand supports orders, but buyers pay more for inputs as exports weaken.
Factory input costs can reach goods importers through supplier quotes and surcharges, often with a lag. The survey does not say how much of the reported increase has passed through to export prices, and it cannot isolate tariff or energy contributions. It does show that the cost side of the purchasing conversation has not eased as quickly as some ocean benchmarks.
The signals point in different directions for shippers. A container buyer may find lower composite rates on some corridors, yet still face costly inputs or longer delivery windows. A domestic LTL shipper may hear of new tariff schedules while its negotiated discount remains a separate matter. A lower ocean index or a carrier’s general rate notice alone does not measure the total cost of moving a shipment.
Diesel adds a separate cost signal. The US Energy Information Administration’s weekly on-highway diesel series was $6.382 a gallon on September 28, down from $6.529 the prior week. It was above $5.967 four weeks earlier. The pullback offers operators some relief, but one lower print does not erase the prior rise or reset contracted surcharges. EIA’s series is a national diesel average, not the price every carrier pays. Fuel adjustments may lag and vary by network, so the series is a direction indicator rather than a direct freight-bill estimate.
Inventories are a lagging check
Census’s inventories-to-sales measure provides a slower check. The FRED series ISRATIO stood at 1.30 in July 2026, versus 1.28 in May and 1.37 in July 2025. This modest annual easing does not show a stock rebuild. July is the newest observation. The October 15 release will show whether inventories rose before the holiday build.
Three checkpoints are dated. ISM’s services survey is scheduled for October 5. Drewry’s next World Container Index update is expected October 8. The Census Bureau’s August manufacturers’ inventories and trade figures are scheduled for October 15. ISM’s services report will show whether slower deliveries extend beyond manufacturing. Post-holiday bookings will offer another read on capacity. Census will update inventories after July’s 1.30 reading. Together, these releases can help distinguish a seasonal pause from a broader change in shipping conditions, although they cannot tell us what any one company pays.
Timing and lane shape the cost question. Golden Week removes export production days now. Blank sailings and October rate initiatives may matter more after factories reopen. Weekly Shanghai-US quotes will show whether composite declines reach importers. Compare them with ISM’s next supplier-delivery and price readings. Together, the prints can distinguish a short schedule mismatch from a wider restocking cycle.
LTL rate change is a separate signal
Old Dominion Freight Line’s 4.9% general rate increase took effect October 5 on tariff books ODFL 559, 670 and 550, according to its announcement. The carrier says customer impact varies by lane, distance and minimum charges. This is an LTL tariff change, not a measure of spot container capacity. For shippers moving palletized freight on US lanes, the published base-rate adjustment is not the final invoice. Accessorials, shipment class, discounts and fuel surcharges shape realized costs.
The contrast with ocean is useful. Container spot quotes differ by corridor and can move with sailings and vessel capacity. LTL pricing works through carrier tariffs and account-level terms, so an announced general increase should not be read as a uniform increase for every customer. The accessible report states the announced increase, but does not provide a representative sample of negotiated customer rates. That leaves the impact on individual budgets uncertain.
This content is for informational purposes only and does not constitute financial advice. Past performance is not indicative of future results. Consult a qualified financial advisor before making investment decisions.
Get daily intelligence delivered
Create a free account for the Daily Brief every weekday and The Week Ahead every Sunday. No card required.