equities

Defensive Rotation: What Utilities and Healthcare Outperformance Signals for Market Positioning

Published September 2, 20265 min read
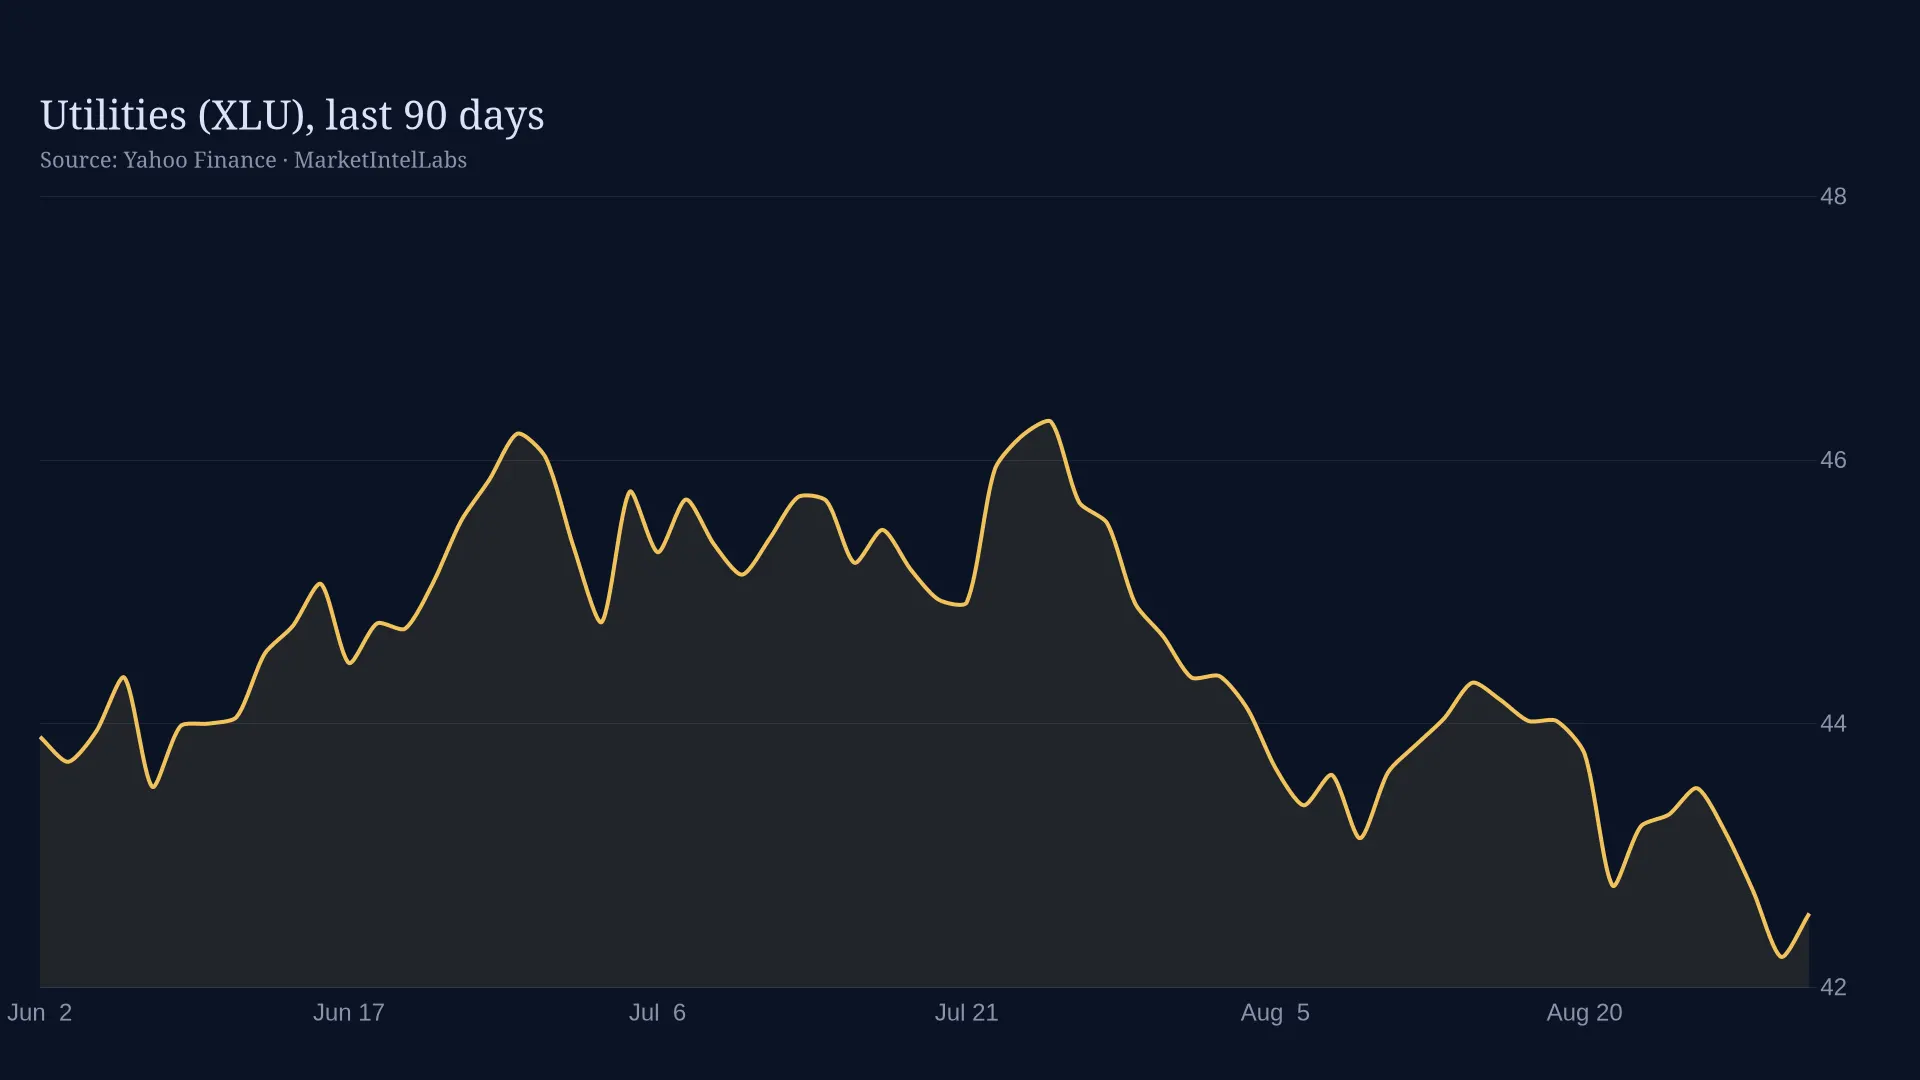
Line chart of Utilities (XLU) price over 90 days

Utilities and healthcare posted gains while technology and consumer discretionary led declines on September 2, signaling a clear defensive rotation as volatility climbed. The Utilities ETF (XLU) rose 0.78% and Healthcare ETF (XLV) gained 0.66%, while Technology (XLK) fell 1.53% and Consumer Discretionary (XLY) dropped 1.72% according to Yahoo Finance data (2026-09-02). This pattern suggests institutions are reducing exposure to high-beta growth stocks and shifting toward stability amid rising uncertainty.

Volatility expectations jumped on September 2 as the CBOE Volatility Index (VIX) surged 9.52% to 16.34 according to CBOE data, marking its highest level since August 19. While the index remains well below its 52-week high of 35.30, the single-day spike suggests a shift in market sentiment from complacency to caution. This move likely reflects positioning adjustments ahead of key economic data releases, including the nonfarm payrolls report on September 5 and Federal Reserve policy expectations.

Defensive sector rotations like this one have historically coincided with transitions in market regimes. When utilities and healthcare outperform while technology lags and the VIX surges more than 8% in a single session, it often indicates that institutional investors are reducing risk exposure. The breadth of this shift sets it apart from typical sector rotations. Seven of eleven S&P 500 sectors declined on September 2 according to S&P Dow Jones Indices data, with defensive names being the only groups to post meaningful gains.

Sector performance comparison showing Utilities (XLU) +0.78%, Healthcare (XLV) +0.66%, Technology (XLK) -1.53%, and Consumer Discretionary (XLY) -1.72% on September 2, 2026. Source: Yahoo Finance, retrieved 2026-09-02

Market breadth metrics confirm the scope of risk-off positioning. The advance-decline ratio for the S&P 500 stood at 0.64, indicating 62% of stocks declined according to S&P Dow Jones Indices data. This represents a meaningful deterioration from the prior session's 0.71 ratio, when 58% of stocks declined. The shift suggests that selling pressure is spreading beyond high-flying growth names into broader market segments.

Technical indicators paint a nuanced picture. The percentage of S&P 500 stocks trading above their 50-day moving average dropped to 58% from 62% the prior day according to index data, while the percentage above the 200-day moving average held steady at 72%. This divergence indicates that while long-term uptrends remain intact, short-term momentum is weakening. The S&P 500 is now 2.3% below its recent high, with the SPDR S&P 500 ETF (SPY) at $761.78 reflecting similar weakness.

Options positioning reveals heightened hedging activity. The CBOE equity put-call ratio climbed to 0.92 from 0.85 according to CBOE options data, approaching levels that historically have coincided with short-term market bottoms. Traders are buying more protective puts relative to calls, suggesting institutional investors are buying insurance against further downside while not yet capitulating on equity exposure.

Institutional flows into defensive sectors reflect a portfolio rebalancing rather than wholesale risk reduction. Utilities and healthcare share characteristics that make them attractive during uncertainty periods: stable earnings regardless of economic conditions, consistent dividend yields, lower correlation to economic cycles, and regulated returns that provide predictable cash flows. Healthcare benefits from non-discretionary spending, while utilities offer regulated monopolies with rate-predictability.

Technical support levels will determine whether this rotation represents a buying opportunity or the start of a deeper correction. The SPDR S&P 500 ETF (SPY) has support at its 50-day moving average around $751 according to technical analysis data. A break below that level would open the door to a test of the 200-day moving average near $735. The Invesco QQQ Trust (QQQ) is showing more weakness, down 1.27% and trading at $707.64, 4.1% below its recent peak according to Nasdaq data. Its 50-day moving average at $702 will be the first support level to watch.

The contrarian case deserves consideration. The selloff was relatively modest with the S&P 500 losing less than 1%. Volume was elevated but not extreme at 40.1 million shares according to exchange data. The VIX spike may represent a short-term overshoot rather than a sustained shift in volatility regimes. If upcoming economic data surprises to the upside, the market could quickly reverse led by the same growth sectors that underperformed on September 2.

Key levels to watch will determine the next direction. A sustained VIX move above 20 would signal that volatility expectations are shifting structurally higher, which typically weighs on growth stocks disproportionately. The yield curve also matters. A steeper curve would benefit financials and could support broader equity performance. The 10-year Treasury yield at 3.72% versus the 2-year at 3.88% according to Treasury data remains inverted, a condition that historically has preceded economic slowdowns.

Friday's nonfarm payrolls report will be the critical catalyst. Consensus estimates call for 175,000 new jobs according to Bloomberg survey data. A print above 200,000 could reignite growth sector leadership, while a sub-150,000 reading would reinforce the defensive rotation narrative. Either way, the current sector positioning suggests institutions are preparing for either outcome by increasing exposure to sectors that perform across economic scenarios.

This defensive rotation signals that institutional investors are becoming more selective and risk-averse, but not outright bearish. The money flowing into utilities and healthcare represents a tactical allocation rather than strategic de-risking. What appears to be ending is the phase where broad index exposure delivered strong returns regardless of sector selection. Success in the current environment will likely require more deliberate positioning in sectors with earnings visibility and balance sheet strength.

The VIX level of 16.34 remains below the 20 threshold that would signal elevated volatility risk per historical CBOE data. SPY's proximity to its 50-day moving average at $751 rather than its 200-day suggests corrections remain contained rather than structural. Watch these levels closely in the coming days. A sustained breach would confirm that the September 2 rotation marks the start of a more significant risk-off phase.

This content is for informational purposes only and does not constitute financial advice. Past performance is not indicative of future results. Consult a qualified financial advisor before making investment decisions.

Get daily intelligence delivered

Create a free account for the Daily Brief every weekday and The Week Ahead every Sunday. No card required.