Gold and Oil Face Competing Forces on July 30
Gold trades at $4,087/oz as geopolitical risk from the US-Iran conflict and the Fed's hawkish pause pull commodities in opposite directions on July 30.
Daily coverage · David Morales
Gold, silver, oil, copper and agriculture — supply, demand and price levels.

Gold trades at $4,087/oz as geopolitical risk from the US-Iran conflict and the Fed's hawkish pause pull commodities in opposite directions on July 30.

Oil jumped 4% on Iranian strikes. Gold barely moved. The divergence between two inflation-hedge commodities reveals how the market is reading the September rate path.

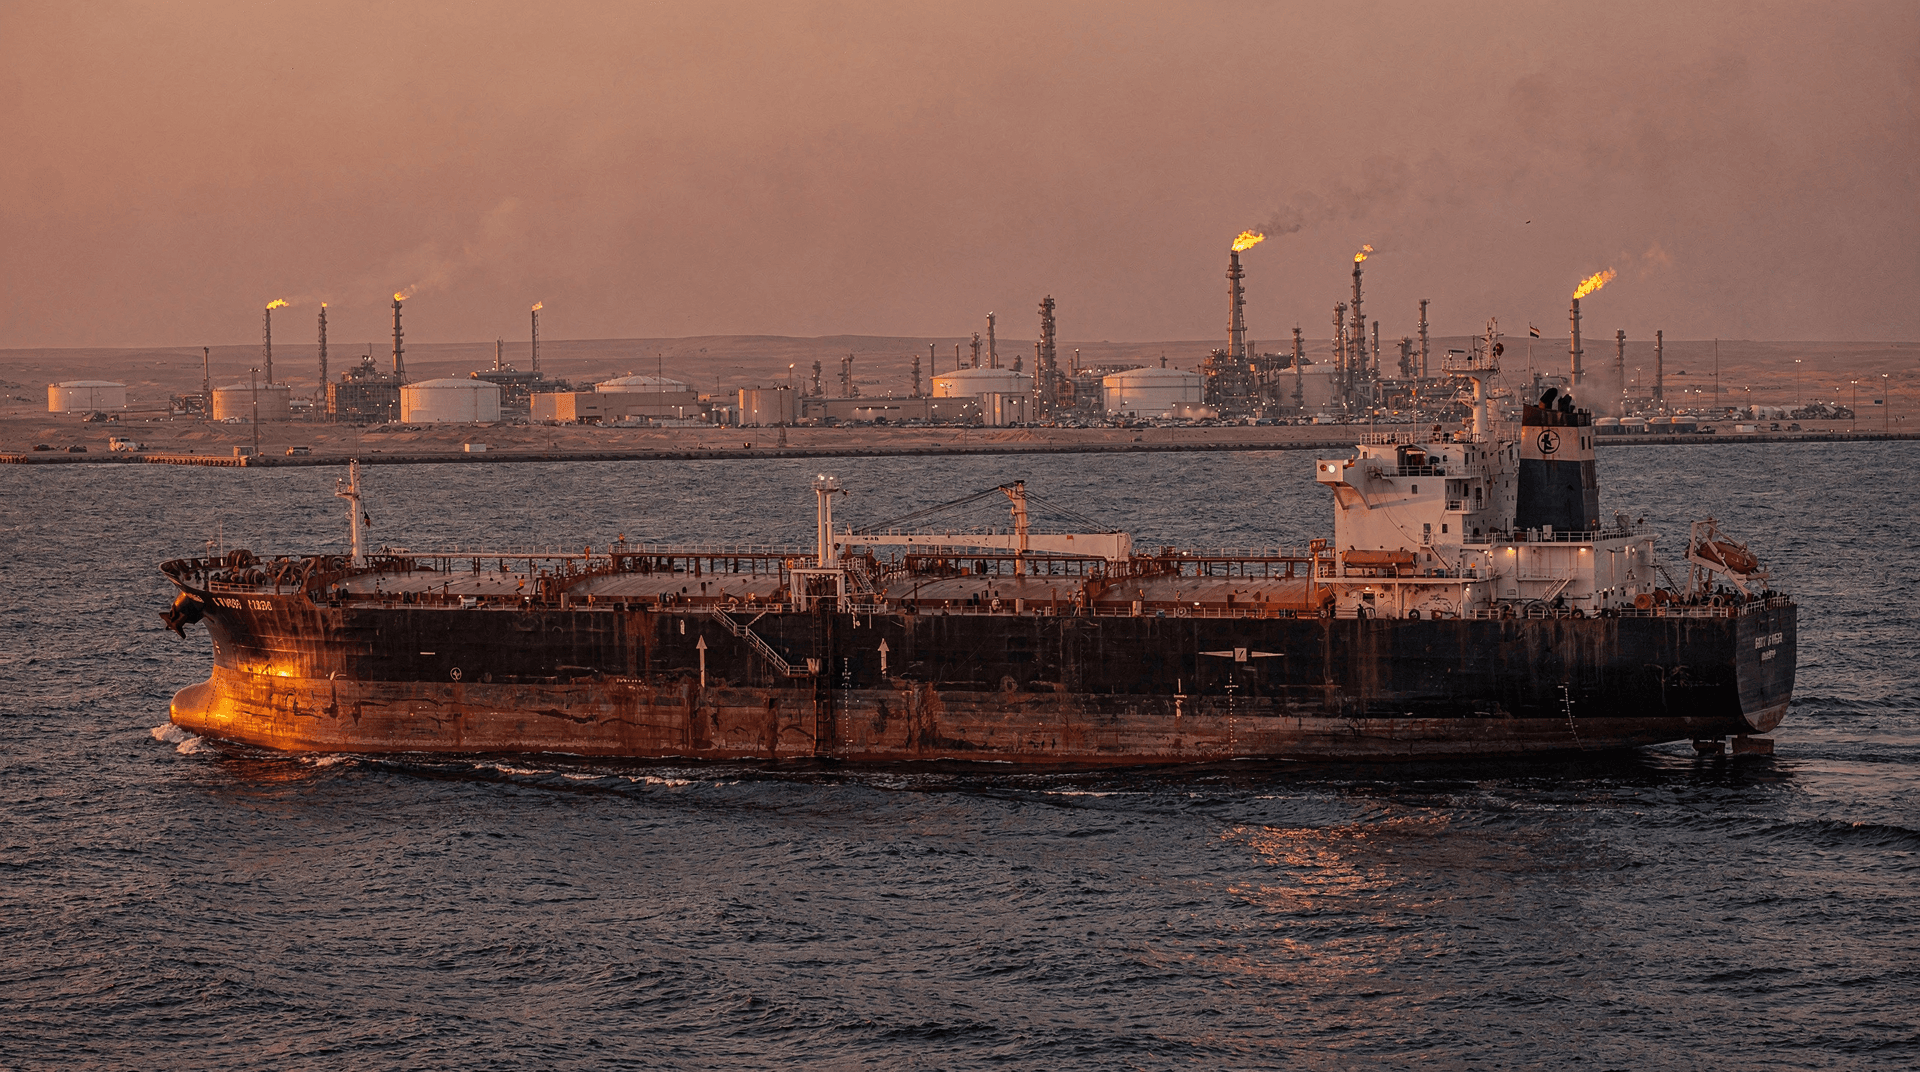
WTI crude surged to $82.54, up more than 4%, after Iranian forces attacked US troops and Saudi Arabia's Eastern Region oil facilities. Here is what the move means and what to watch next.

Gold held $4,000 after the Fed's July 29 hold because the decision was already priced in. The real question is what 183,910 CFTC net long contracts and an 82% September hike probability mean for the next move.

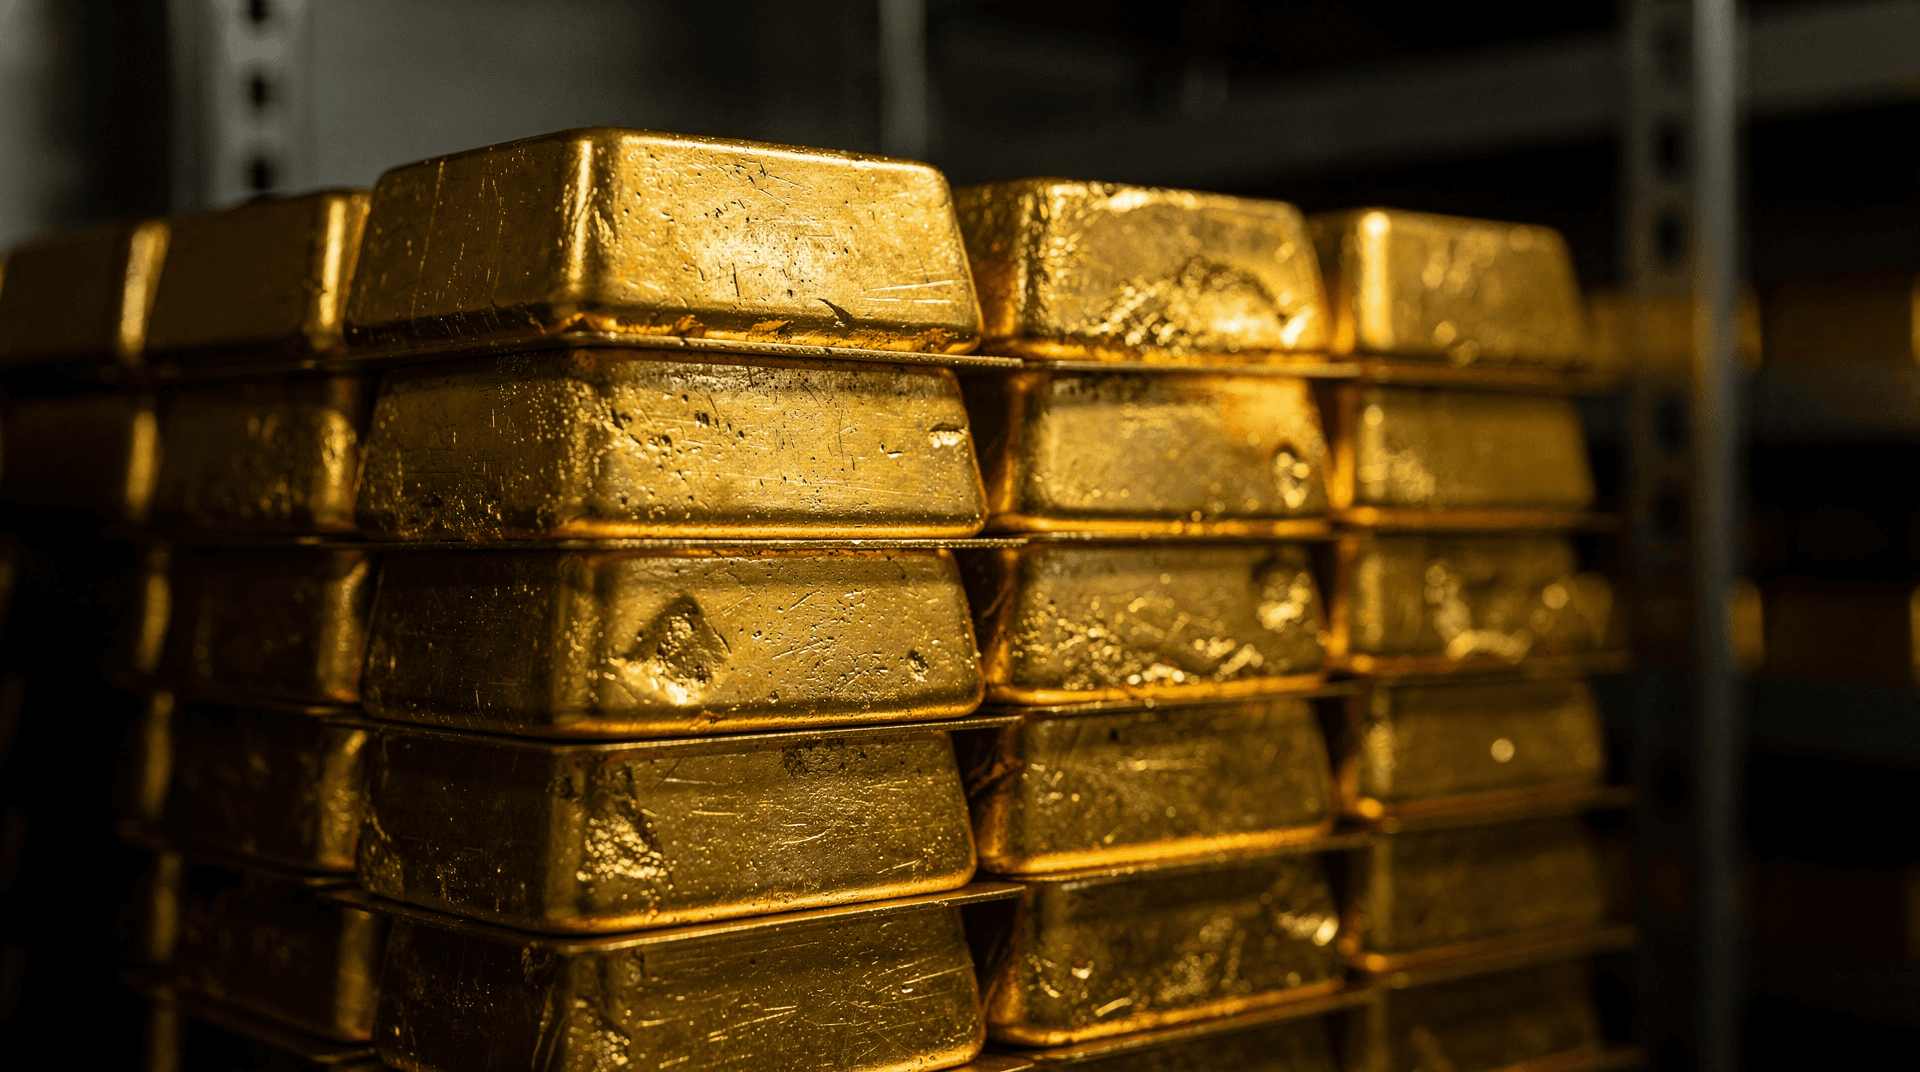
U.S. Treasury's July 24 action against the DotOne conglomerate exposed how Iran-minted gold bars were tokenized, routed through a sanctioned exchange, and cleared across UAE and Turkish fintech nodes to reach international counterparties outside SWIFT. The architecture represents a maturation point in Iran's sanctions-evasion infrastructure: no longer ad-hoc oil barters, but a vertically integrated commodity-to-crypto settlement layer.

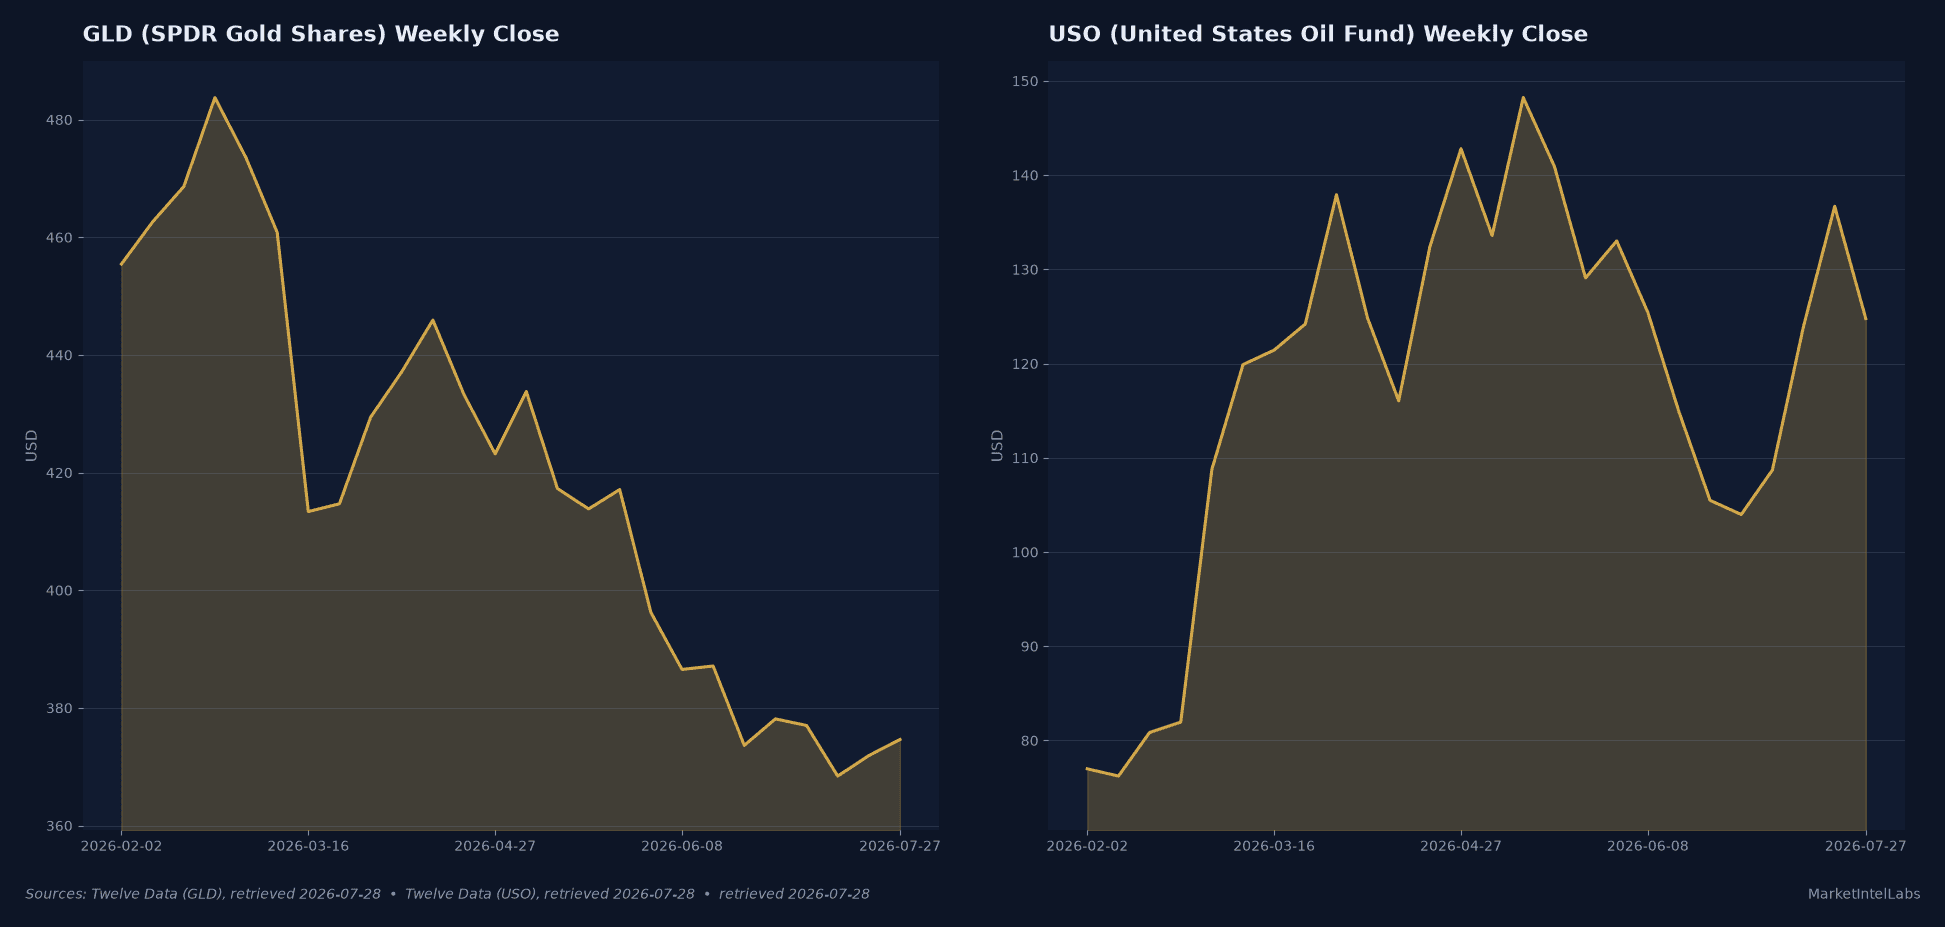
GLD holds $364.96 support while USO drops 8.73% on OPEC+ supply ramp. With the Fed meeting July 28-29, here are the levels that matter across gold, silver, oil, and copper.

WTI crude is down 35.5% from its March 2026 peak as US-Iran ceasefire talks progress in Oman. Gold holds above key support despite easing fear premium. Trump's Section 301 tariffs on 60 countries hit agriculture ETFs. Here is how each setup reads now.

On July 22, the Trump administration signed two nuclear policy moves: a framework to evaluate offshore reactors on the US Outer Continental Shelf, and a 30-year cooperation deal with Saudi Arabia that may permit domestic uranium enrichment. Here is what both moves mean for uranium spot prices, oil markets, and the commodity trades tied to the nuclear buildout.

WTI crude fell 5.44% to $84.45 as OPEC+ confirmed a 548,000 bpd output increase for August. Copper holds structural support near $6.36 on tariff fears. Wheat gets a geopolitical jolt from Kerch Strait closure.

Gold at $4,089/oz is up 23.7% YTD but sits well below January's $5,405 peak. Central banks bought 244 tonnes net in Q1 2026, the third consecutive quarter above the five-year average. Here is what the positioning, technical, and macro data say about the road from here.

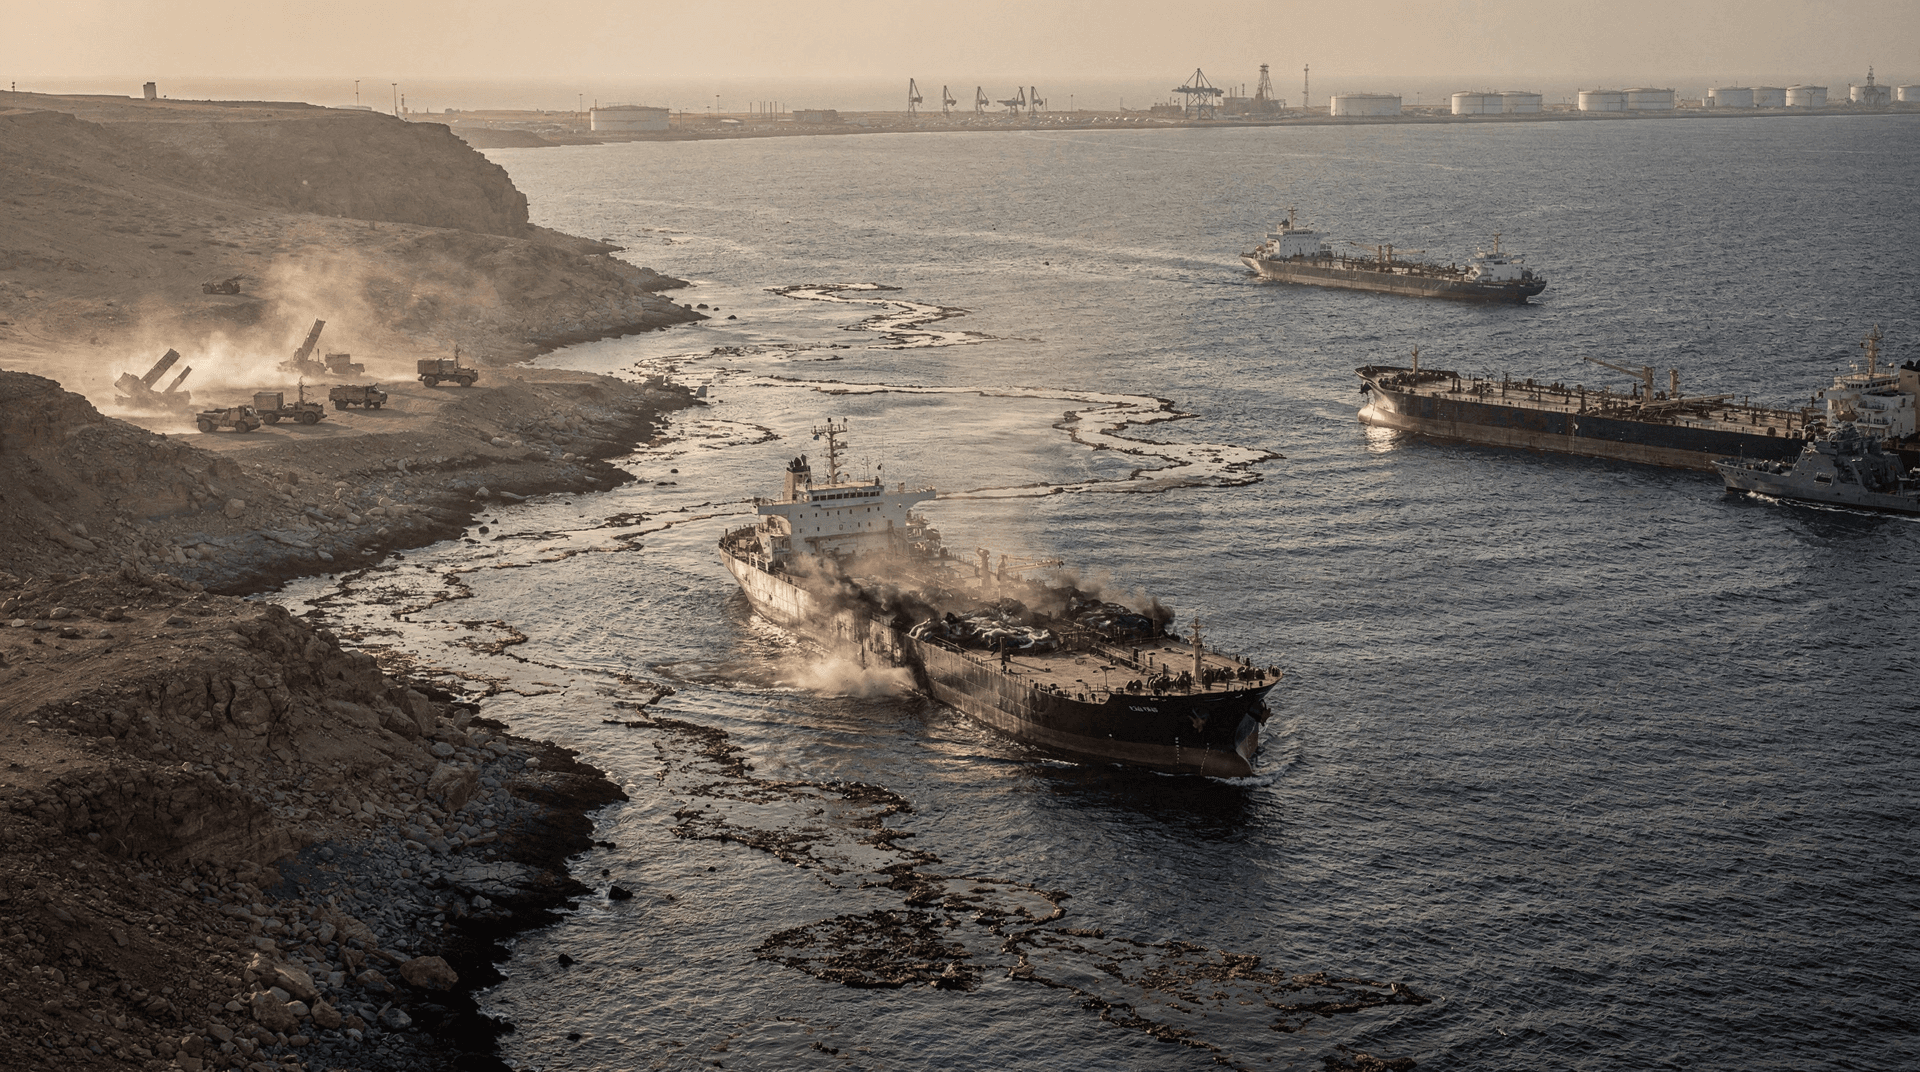
Houthi forces declared a naval blockade of Saudi Arabia this week and struck two tankers transiting the Red Sea, closing the very bypass route that markets treated as a pressure valve for the near-fully blocked Strait of Hormuz. Combined non-Hormuz pipeline bypass capacity amounts to roughly 8.7 mb/d against Hormuz's pre-war 20 mb/d throughput. Meanwhile, Washington's threat to pay shipping damages from frozen Iranian money runs into a structural problem: the law that freezes the assets does not authorize seizing them.

Oil surged 5.9% after Trump declared the Iran ceasefire dead, while gold and silver pulled back on pre-FOMC positioning. Here is what each move means and what to watch next.