The Week Ahead: FOMC Minutes, the Diesel Crunch, and Earnings Test a Narrowing Rally


The defining fact for the trading week ahead is a contradiction the market refuses to resolve: Brent last closed at $102.31 a barrel and US diesel near $6.39 a gallon on supply shocks that are already in price, while the S&P 500 grinds within 2% of its record on a base so narrow that 575 NYSE stocks made new 52-week lows last week against just 70 new highs. Into that standoff lands the week's only true catalyst, the Federal Reserve's September meeting minutes on Wednesday, bracketed by speeches from Vice Chair for Supervision Michelle Bowman on Tuesday and Governor Christopher Waller on Thursday. Nothing on this week's calendar (no CPI, no PPI, both of which land on October 14-15) is clean enough to resolve the tension on its own, which is exactly why the minutes carry more weight than a late-stage Fed artifact usually would. The thesis for the week: expect the minutes to confirm a market already positioned for a skid to December, watch the products complex for the re-acceleration risk that money-supply and energy data keep feeding, and treat equity strength as a concentration signal until breadth joins it.
The week ahead at a glance
Monday the 5th offers breadth data and positioning rather than a hard catalyst, with the OPEC+ decision over the weekend largely priced as quota-hold. Tuesday the 6th brings Vice Chair for Supervision Michelle Bowman's speech on modernizing regulation and supervision at 14:45 UTC, watch for any read on the supervisory agenda and, only secondarily, on policy. Wednesday the 7th is the week's headline: the Federal Open Market Committee releases minutes of its September 15-16 meeting at 18:00 UTC, the first hike in three years, a 25 basis point move that took the target range to 3.75%-4.00%, alongside the Summary of Economic Projections that put the year-end policy rate at 4.1%. The Energy Information Agency's weekly petroleum status report lands the same day and is the oil-market catalyst, after last week's build of 0.9 million barrels to 427.3 million (still about 2% above the five-year average) against distillate stocks running 14% below the five-year average. Thursday the 8th adds Governor Christopher Waller's economic-outlook speech at 08:30 UTC and the weekly jobless claims print, which takes on modest significance now that the September employment situation is in the rearview. Friday the 9th closes the week with producer and wholesale inventory data but no tier-one print. The heavy hitters (September CPI on October 14 and PPI on October 15) sit just outside the window, so the front end of this week is about texture, not fireworks.
What the FOMC minutes can do
For the deeper read on what the term premium is doing to the 10-year, see The Weekend Brief: When the 10-Year Tells You Who Is in Charge; for the broader policy framework, our Fed policy coverage collects the running analysis.
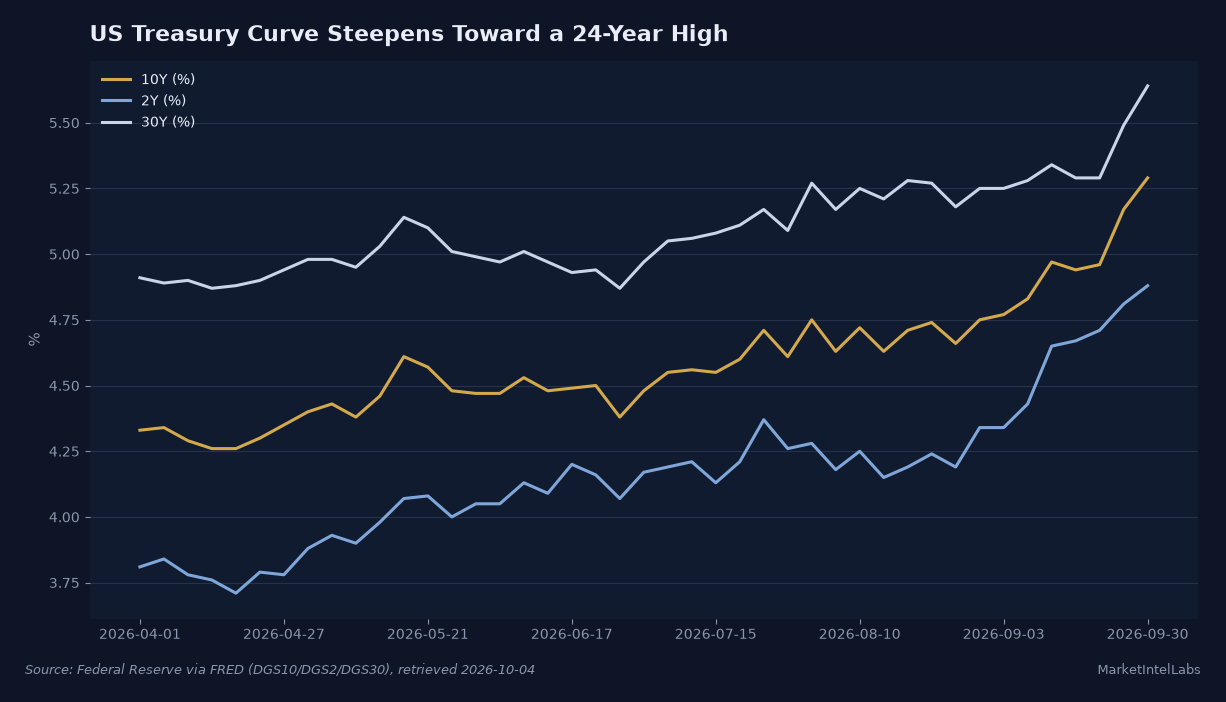
The September 15-16 statement and SEP are already public, so the minutes add color rather than direction, but color is this week's entire ballgame. The market has priced the October 27-28 meeting at roughly a 66% hold and a 30% hike on Kalshi, a dramatic repricing from a week ago when an October move looked near a coin flip, driven by Williams' "no need for urgency," Jefferson's call for "more time," and Logan's characterization of September as a "first step." The 10-year sits at 5.29%, a 24-year high, with the 2-year at 4.88% and the 30-year at 5.64%, and the curve has steepened to about +46 basis points from +25 on September 22. The bull read is that go-around on the decision itself, the minutes show a committee genuinely split, which validates the market's shift to December as the base case and lets the front end breathe. The bear read is the one the minutes can actually create: if the record shows members more worried than the statement let on about re-accelerating inflation from the energy shock (gasoline was up 4.4% month-over-month in August PCE), the minutes can be read as more hawkish than the statement even without any new commitment, and that pushes the long end through 5.3% and hits duration hardest. Balance-sheet runoff guidance is the quiet second thread; any color on how much longer the committee sees the runoff continuing rates policy by liquidity rather than by the funds rate. The honest expectation: minutes rarely clear 5.29% yields on their own, but they are the one document this week capable of confirming or fracturing the December-skip consensus, and that confirmation is what a 10-year at 5.29% and a bitcoin at $86,000 are both waiting on.
The diesel and Brent backdrop carried into the week
The crude complex enters the week with the supply shock already marked in price. Brent's most recent close (last Friday) was $102.31, up 4.37% on the week, and WTI at $92.87, up 2.71%, the settlement driven by the report of a third US aircraft carrier and roughly 10,000 additional troops being deployed, China's October suspension of fuel-product exports beyond Hong Kong and Macau, and Russia's diesel export ban, extended for producers, is now in its final scheduled window into late October. The strike tracker now carries 31 entries through October 2, with the overnight strike on Volgograd's Lukoil refinery (one of Russia's largest, at roughly 14-15 million tonnes a year, fire confirmed by the regional governor) and the claim on the Samara dispatch station that blends the Urals export grade being the newest additions to a confirmed cumulative offline range of roughly 2,177 to 4,485 thousand barrels a day. The IEA puts Russian refinery runs at 3.8 million barrels a day in June, about 30% below a year earlier, and sees roughly 4 million a day for the balance of the year. That is the demand-side context the tracker exists to keep honest, and it is why the US distillate deficit that EIA reported last week (stocks 14% below the five-year average even as crude builds) is the tighter and more consequential number for the week than the headline crude build. The product crack, not flat price, is where the supply shock has transmitted, and the EU stockpile-release chatter and the US diesel-export-ban talk are the two policy levers that could move cracks this week. On Wednesday's EIA report, the single number that matters is whether distillate draws resume after last week's 2.3-million-barrel draw to a level already 14% below average; a continued draw reinforces the squeeze and keeps the crack bid intact into the OPEC+ and stockpile-policy narrative. The two-sided case is real: Gulf supply is recovering (Goldman's estimate puts Gulf exports including dark cargoes near 23.3 million barrels a day, in line with the pre-crisis average), so a repeat of March when China relaxed a similar ban in July, or an OPEC+ quota surprise, could unwind the product premium quickly. For portfolios, Brent above the $102 area with WTI holding $92.87 keeps the inflation-transmission risk squarely on the table for Wednesday's data and for October CPI a week later. For background on the policy response, see G7, IEA release 100 million barrels to break the diesel squeeze.
Equities key levels
Friday's closes leave the index near its highs on the surface and deteriorating beneath it. SPY finished at $763.99, roughly 2% under its all-time high, with QQQ at $742.03 and the Russell 2000 proxy IWM at $279.02; the VIX sits at a calm 16.39. The breadth problem is the headline: the NYSE recorded 575 new 52-week lows against 70 new highs last week, only four of eleven sectors advanced, and cumulative advance-decline lines for both the S&P and the Nasdaq made multi-month lows even as the indices held near highs. Technology is the lone sector in a relative-strength "Leading" position, carrying roughly two-thirds of index weight by market cap; industrials and healthcare are "Improving"; energy, staples, discretionary, real estate, materials, utilities and financials are all "Lagging." That is the setup where a headline print flatters positioning: nearly 1,900 NYSE stocks fell last week against about 919 that rose, even as the index finished higher. The level to watch for the week is whether SPY holds the 760-763 pivot on any hawkish minute Wednesday; a close below it with breadth still contracting argues the index-led top is building rather than resolving, while a reclaim of the all-time-high zone depends on the yields cooperating, which a 10-year at 5.29% makes unlikely without a dovish surprise. Earnings are sparse this week (no mega-cap tech and no banks until the mid-month kickoff), which leaves macro, and specifically the minutes and the EIA report, running the tape. The bull case is that this is late-cycle concentration, not a fragile top: technology's earnings power justifies the premium and rates stabilize once the energy impulse rolls over. The bear case is that a 5.29% 10-year is precisely the discount-rate channel that breaks a 67%-tech index first. The data through Friday supports the bear's case on breadth and the bull's case on momentum, and the minutes are the tiebreaker.
Crypto context
Bitcoin enters the week near $85,200 after a 2.0% Friday gain to roughly $85,236, extending the recovery from the late-September swing low, with Ethereum near $2,696 and Solana near $122. The institutional signal is steadying rather than roaring: US spot Bitcoin ETFs ended a nine-day, roughly $3.1 billion inflow streak with $148.7 million of outflows on September 30, then returned to a modest $102.7 million net inflow on October 1, leaving cumulative net inflows near $57.7 billion and 2026 year-to-date flows back in positive territory. Ether funds were the laggard, with a second straight outflow day. The macro read is identical for crypto to equities: a 10-year at roughly 5.28% caps the risk multiple, and the October-hike probability that fell from about 51% to 38% on the softer core-PCE print is the swing factor crypto trades on more than its own news. On the regulatory side, an OFAC action on a crypto-funding perimeter is being researched by the newsroom, and is worth monitoring as a potential compliance development, though it has not moved the market yet and carries no named parties in this dispatch. On-chain data is quietly constructive, with USD stablecoin supply up about $4.1 billion week-over-week to $313 billion, a sign of freshly deployable fiat waiting in the wings. The key level is whether Bitcoin holds $85,000 into Wednesday; a hold with a dovish minutes read opens a push through $86,500, while a hawkish read and a 5.3% 10-year pressures the late-September swing low that has now held twice. The policy backdrop: OFAC's October 2 designations: sanctions perimeter sets the perimeters the institutional flows are watching.
Two-wars dashboard
The franchise fact sheet, refreshed daily by the commodities desk, keeps the conflict-driven supply backdrop honest for the week. As of the dates shown, Hormuz transits stood at 1 daily transit versus an 85-per-day baseline, Brent settled at $104.32 on 2026-09-25, the ULSD crack versus Brent ran at $92.44, EU diesel prices were up 38 percent year over year, and Russian refinery crude runs were 3.8 million barrels a day in June, about 30 percent below a year earlier. The line version of the dashboard reads:
Two-wars dashboard: Hormuz transits (daily) 1 vs 85/day baseline; Brent settle 104.32 $/bbl; ULSD (HO) crack vs Brent 92.44 $/bbl; EU diesel price y/y 38%; Russian refinery crude runs 3.8 mb/d (June; ~30% below year earlier); EU gas storage 70.6%; Ukraine agricultural exports, August (all routes) 1.48 Mt (-48.6% MoM; Odesa ports 152,126 t, -93.6%) (oldest figure as of 2026-09-11).
The oldest figure is as of 2026-09-11, and the newest table entries are dated the days they were refreshed. The full sourced table:
What would surprise consensus
Two scenarios would move a portfolio more than the base case this week, and both are reachable. The first is a hotter-than-expected EIA distillate print compounding a hawkish read of the minutes: if Wednesday shows distillate stocks drawing hard again while the minutes record genuine concern about energy pass-through inflation, the 10-year pushes decisively through 5.3%, the concept of the December hold fractures, Bitcoin gives back its $85,000 footing, and high-duration equities take the hit hardest while the product complex and energy equities are the only place with a bid. The second, quieter surprise is the opposite tail: a soft distillate build plus minutes that show the committee leaning on the re-benchmarked core as cover to wait would compress the front end, send gold and bitcoin up, and finally let breadth follow an equity index that has run ahead of its internals for five weeks. The positioning that survives both is the one the data has argued for all week: own the inflation-protected assets at the level-protected prices (gold holding the $4,168 area, silver above $60, energy exposure for the crack rather than for crude direction) and keep the equity-duration book modest until either the 10-year breaks 5.3% to the upside or breadth confirms the highs to the downside. The week's gift is that the two surprises pull in opposite directions, which is precisely why Wednesday's minutes and Wednesday's EIA report, taken together, matter more than either would alone.
This content is for informational purposes only and does not constitute financial advice. Past performance is not indicative of future results. Consult a qualified financial advisor before making investment decisions. Sources include Federal Reserve FOMC calendar and minutes, US Energy Information Administration petroleum status report, CME/ICE settles via Yahoo Finance and Reuters, CFTC and equity-options positioning data, the MarketIntelLabs Russia-refinery strike tracker, and CoinGecko/Farside Investors data as cited by MarketIntelLabs research briefs of October 2, 2026.
Get daily intelligence delivered
Create a free account for the Daily Brief every weekday and The Week Ahead every Sunday. No card required.