13.9 Million Older-Owned Homes May Reach Market by 2036

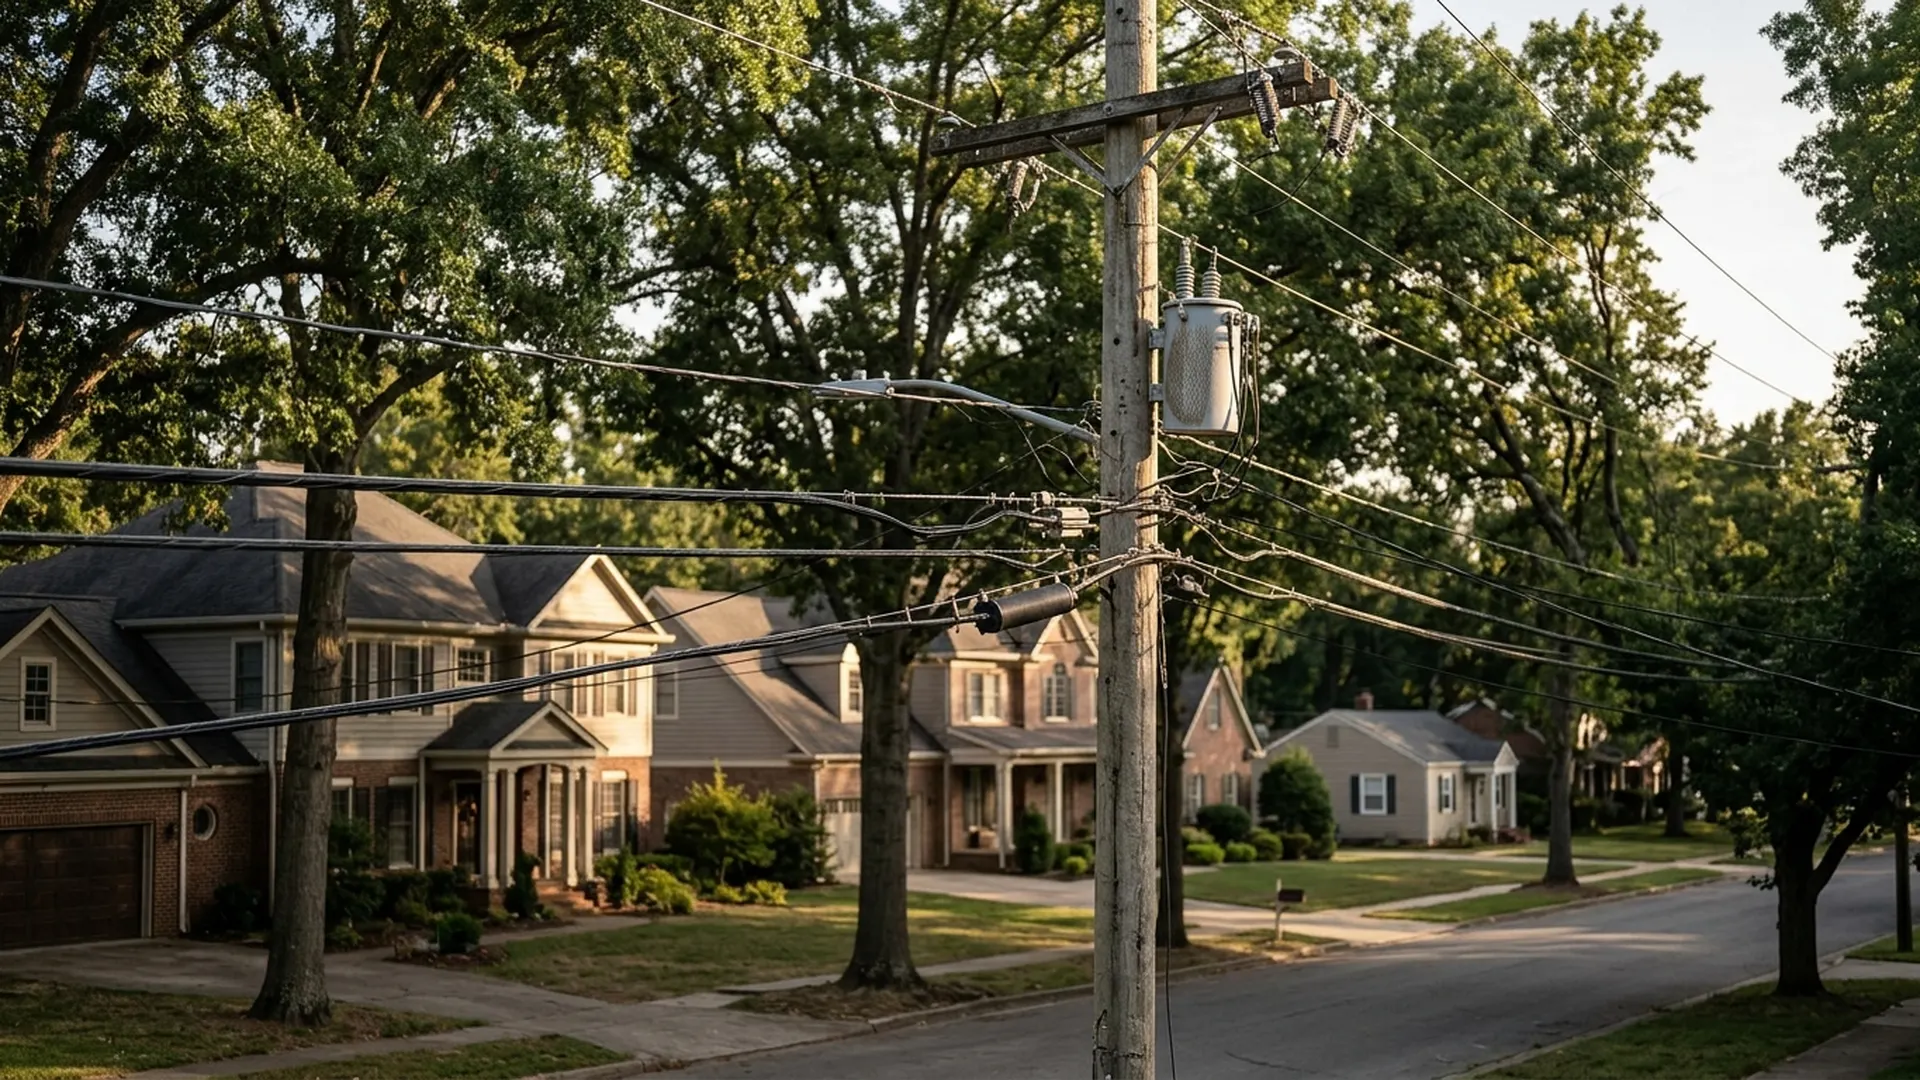
As many as 13.9 million homes now occupied by Baby Boomers and the Silent Generation could be vacated between 2026 and 2036, but the projection does not point to a flood of entry-level listings. Realtor.com’s October 5 estimate assigns just 380,000 of those homes to the starter-home category, a small fraction of the supply first-time buyers need.
The distinction matters because housing shortages are not interchangeable by bedroom count, location or price. More four-bedroom houses in a slower-growing market can ease pressure for some households without creating an affordable first purchase in a high-cost metro.
Related reading: Mortgage Rates Hit 6.95%: The Payment Math That Turns Inventory Into Price Cuts.
Realtor.com’s October 5 study estimates that Baby Boomer and Silent Generation households occupy 36.7 million homes in 2026, declining to 22.8 million by 2036. The difference, 13.9 million homes, is the study’s estimate of net homes vacated as owners die, move to institutional care, consolidate households or shift to renting. Its projected annual pace rises from about 1.27 million in 2027 to 1.52 million in 2036, averaging 1.39 million a year.
The estimate is larger than the prior decade’s handoff. Realtor.com calculates a 33.7% increase over the 10.4 million homes relinquished by older households from 2016 to 2026, and a 74% increase over the 8 million released by the two generations themselves in that period. The report says the transition shifts toward Boomers around 2029, so most of the projected flow is spread across years rather than arriving at once.
Related reading: Freddie Mac's 7.28% Rate Reprices Fall Housing Demand.
These are modeled household transitions, not a forecast of homes listed for sale. Some homes will pass to relatives, become rentals, or be replaced through new construction and household moves. The study does not claim every vacated home becomes an available listing. That distinction is central to the headline number.
Starter supply is the weak link
The report estimates 380,000 starter homes with zero to two bedrooms will be released over the decade. That is 3.2% of Realtor.com’s annualized recent starter-home listing base, based on homes listed between July 2025 and June 2026. By contrast, family homes with three or four bedrooms account for 9.9 million projected releases, equal to 24.7% of their annualized listing base. Large homes with five or more bedrooms account for 3.6 million releases, equal to 67.2% of their current listing base.
Related reading: The 7% Mortgage Rate Meets Rising Home Supply This Fall.
For buyers priced out of a first home, the mix is more important than the aggregate. The 380,000 starter-home estimate averages roughly 38,000 a year, while the annual releases across all home types average 1.39 million. This arithmetic uses Realtor.com’s decade estimates divided by ten; it is not a prediction of annual sales or net inventory growth. The number of homes that actually reach the market will depend on heirs, ownership transfers, rental decisions and local conditions.
There is also an important baseline caveat. Realtor.com reports 5.72 million unique homes listed from July 2025 through June 2026, 9.0% below its pre-pandemic annual average of 6.29 million. Its scenario says that if 44.8% of the projected 1.27 million releases in 2027 reached the open market, that volume would close the listing gap, all else equal. This is a conditional comparison, not an expected 2027 listing count.
Related reading: Existing-Home Sales Sink as Supply Hits a Decade High.
Affordability still depends on rates and price
Aging-related supply will not erase the payment squeeze facing buyers now. Freddie Mac’s October 1, 2026 PMMS put the 30-year fixed mortgage rate at 7.28%, compared with 6.34% on October 2, 2025, according to the series distributed by FRED. For a $400,000, 30-year fixed loan, principal and interest at those rates is about $2,729 and $2,489 per month, respectively, a difference of roughly $240. This illustration holds the loan amount fixed and excludes taxes, insurance, mortgage insurance and fees.
The national median existing-home price in the latest available FRED series was $410,700 in the second quarter of 2026, versus $412,300 in the fourth quarter of 2025 and $410,100 in the third quarter of 2025. These are quarterly figures, not an October asking price or a local valuation. A small change in the national median does little to offset the payment increase from the mortgage rate move, and the price series measures completed existing-home sales, not the older-owner projection.
Realtor.com’s September 2026 listing report supplies a more immediate demand check. It found 20.8% of listings had price reductions, up 0.9 percentage points from a year earlier and the highest September share since 2018. Active listings exceeded 1.16 million, up 5.5% year over year, while pending sales were down 4.1%. The same report showed regional variation: inventory rose 11.6% in the Northeast and 11.3% in the Midwest, compared with 2.6% in the South.
Realtor.com built the projection using American Community Survey data from 2014 through 2024 and age-specific homeownership retention rates. It chains those historical transitions forward, then estimates how many owner-occupied homes will be relinquished. The study’s own conclusion is a gradual and uneven effect, concentrated in family and larger homes and varying by metro, not a uniform price decline.
The risks to the estimate run in both directions. Retention patterns can change as health, family structure, care costs and housing policy change. A home that leaves owner-occupancy may still remain in the housing stock, but it might not be offered for sale. Conversely, a transfer could produce a listing earlier than the model’s average pace. New construction, household formation and mortgage rates will continue to shape net supply alongside this demographic shift.
The useful signal is therefore not a single national number but the composition of actual listings over time. For starter buyers, watch whether zero-to-two-bedroom inventory rises in their local market, whether months of supply improves, and whether price cuts translate into more pending contracts. The projected generational transfer is meaningful for overall supply, but the study’s own breakdown says it is unlikely to solve the entry-level shortage on its own.
Sources: Realtor.com Economic Research, 2026 Realtor.com Generational Housing Succession, published October 5, 2026; Freddie Mac PMMS via FRED, MORTGAGE30US; Census Bureau via FRED, median sales price of houses sold, MSPUS; Realtor.com Economic Research, September 2026 Monthly Housing Trends, published September 30, 2026.
This content is for informational purposes only and does not constitute financial advice. Past performance is not indicative of future results. Consult a qualified financial advisor before making investment decisions.
Get daily intelligence delivered
Create a free account for the Daily Brief every weekday and The Week Ahead every Sunday. No card required.