Existing-Home Sales Sink as Supply Hits a Decade High


Existing-home sales fell to a seasonally adjusted annual rate of 3.98 million in August, down 2.0 percent from July and 1.2 percent from August 2025, according to the National Association of Realtors report released September 10. That is the slowest pace since June 2025 and the third straight monthly decline. At the same time, unsold inventory climbed to 1.62 million units, which works out to 4.9 months of supply at the current sales pace, the highest reading in more than ten years.
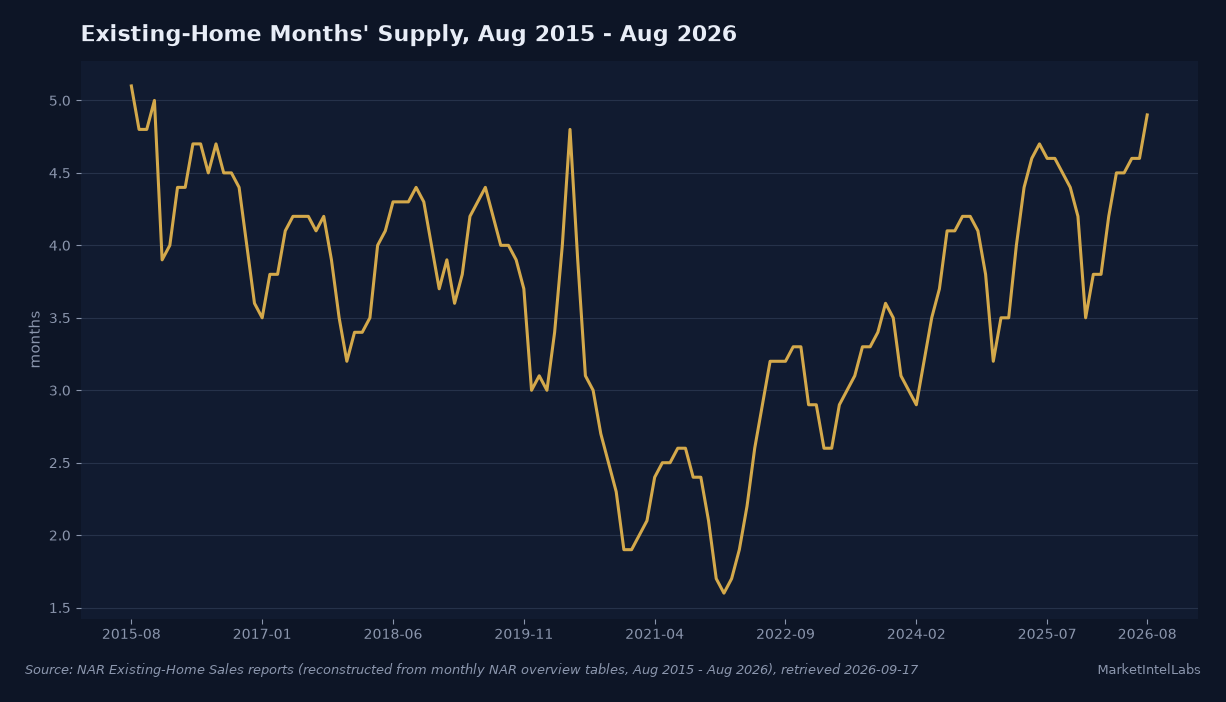
Read those two lines together and you get the real story of this market. Sales volume is collapsing back toward the 30-year lows of the past three years, yet the supply side is loosening faster than at any point since before the pandemic. One of those facts is about demand. The other is about time.
Sales are rate-shocked, supply is structural
The demand story is straightforward. Mortgage rates averaged 6.76 percent in the week of September 10 per Freddie Mac, up from 6.35 percent a year earlier. Most August contracts were signed in June and July, when the rate ranged from 6.43 to 6.66 percent, so buyers were signing into a market that had been getting more expensive for four straight months. NAR chief economist Lawrence Yun put it plainly: mortgage rates and home sales move in opposite directions.
The supply story is more interesting because it is not a demand artifact. Inventory of 1.62 million units was up 3.2 percent from July and 5.9 percent from a year ago, and it is the first month since November 2019 that listings cleared 1.6 million. Months of supply rose from 4.6 in July to 4.9, and 4.6 is also the year-ago reading, so the increase is not seasonal noise. Homes are accumulating because volumes are falling faster than listings, and because new construction keeps adding units. Census data show housing starts at 1.239 million in July, and single-family completions have been running near 1 million annualized for months. Houses are being built and bought slowly at the same time.
Prices are still rising, which tells you where the balance sits
Here is the puzzle worth sitting with. A decade-high months-of-supply reading would normally push prices flat or lower. Instead the median existing-home price rose 1.6 percent year over year to $429,100, an August record in data back to 1999, and the 38th consecutive month of annual gains. Regional detail explains part of it. The Midwest median rose 3.3 percent to $340,400 and the Northeast is effectively sold out at 4.0 months of supply, while the West median actually slipped 0.2 percent to $619,100 and the South, where most of the new building is, managed just 0.7 percent growth on unchanged sales. Supply is abundant where builders have been building and scarce where the existing stock is locked in.
Run the affordability math and the tension shows up in one payment. Take the national median of $429,100 with 20 percent down, a $343,280 loan. At the current 6.76 percent rate the principal and interest payment is about $2,229 a month. At the 6.58 percent rate of a year ago it was about $2,188. Roughly $41 a month does not sound like much, but it lands on top of a price that is 1.6 percent higher and insurance and tax costs that have been rising faster than either. The NAR Housing Affordability Index printed at 104.7, up from 101.2 a year ago, which sounds like improvement until you notice it means a family earning the median income has barely more than the income needed to qualify for the median home.
The negotiating window buyers have been waiting for
The behavioral data says buyers already sense the shift. The median home spent 31 days on the market in August, up from 29 days in July. First-time buyers were 30 percent of sales, up from 29 percent in July and 28 percent a year ago, a small but real sign that the marginally locked-out buyer is getting back in. Yun's own framing is that ample supply is giving buyers better opportunities to negotiate. For the first time in this cycle, the data supports that rather than contradicting it.
What to watch from here. The September existing-home sales report lands around October 22, and the key number is not sales, it is whether months of supply holds above 4.8 as the fall season arrives. If it does, price growth nationally should keep decelerating toward the 0 to 1 percent range the South and West are already printing, with the Northeast and Midwest holding up the national median. The September 24 FOMC decision is the swing factor for demand: any credible path to lower short-term rates steepens the curve the wrong way for mortgage pricing, and the 10-year Treasury, not the Fed funds rate, is what the 30-year mortgage follows. Buyers negotiating on price in a 4.9-months market should not assume rate relief arrives on the same schedule.
The data suggests a market that is finally rebalancing, from the sellers' side. It took the slowest sales pace in more than a year to get there, and the median price has not turned yet. But 4.9 months of supply is the strongest negotiating position buyers have held since 2015, and that is a fact worth more than another month of record medians.
This content is for informational purposes only and does not constitute financial advice. Past performance is not indicative of future results. Consult a qualified financial advisor before making investment decisions.
Get daily intelligence delivered
Create a free account for the Daily Brief every weekday and The Week Ahead every Sunday. No card required.