Mortgage Rates Today: Why 7.40% Is Above Treasury Yields


Mortgage rates today are not the Federal Reserve's overnight rate with a bank's markup attached. Freddie Mac's Primary Mortgage Market Survey reported a 7.40% national average for the 30-year fixed loan as of Thursday, October 8, 2026. The 10-year Treasury yield was 5.28% at the latest observation in the Federal Reserve Bank of St.
Louis's DGS10 series, dated October 7. Subtracting those deliberately different observation dates gives a 2.12 percentage point mortgage-to-Treasury gap, not a 2.12-point bank profit. The 10-year was 5.31% on October 5, but using that earlier quote against Thursday's mortgage survey would imply a misleading same-day comparison.
Related reading: Treasury Yields Near 5% as Mortgage Lock-in Traps Homeowners.
The two news reports already on this site cover the print itself: Mortgage Rates Reach 7.40% as Housing Completions Fall and Mortgage Rates Reach 7.40% on October 8 as Payments Climb. This is the separate question a buyer faces after reading those stories: Why does the mortgage quote sit so far above a Treasury yield, and which part could move next? A lender cannot simply subtract a future Fed cut from today's quote. An investor's price for a mortgage bond, the borrower's loan terms and the Treasury market all have a say.
For a $400,000 mortgage, 7.40% works out to about $2,770 monthly in principal and interest on a fresh 30-year schedule. At 6.40%, the same loan and term would be about $2,502, a difference of roughly $268 per month. That is a scenario comparison, not a forecast of a lower available rate; property taxes, insurance, HOA charges and closing costs are outside it. The arithmetic shows why even a change in one component of the rate matters to housing affordability.
Related reading: MBA Mortgage Applications Fall 4.2% as Rates Hit 7.49%.
How a 30-year mortgage gets its rate
Start with the 10-year Treasury as a reference, not a mortgage funding contract. A Treasury bond promises its stated cash flows absent the sovereign's credit problems. A homeowner can repay a mortgage early, often exactly when lower rates make the existing loan valuable to an investor.
Lenders typically sell conforming loans into agency mortgage-backed securities, or MBS, and the market price of those securities influences the funding rate a lender can offer new borrowers. Freddie Mac's research note on its rate survey explains that Treasury yields anchor MBS pricing, but that mortgage rates need not move in lockstep with Treasuries.
Think of the quoted mortgage rate as three layers: a long-duration Treasury reference; an MBS basis, meaning the extra yield investors demand for holding mortgage cash flows instead of Treasuries; and the costs between the security's yield and a homeowner's note rate. The last layer includes originating a loan, paying a servicer, and financing a guaranty. This decomposition is a teaching aid, not a published daily accounting of the 7.40%. No public observation used here lets us assign the 2.12 points to three exact live slices, and borrowers with different credit scores or discount points will not receive one identical quote.
Freddie Mac's 2019 analysis estimated that origination and servicing together then contributed about half a percentage point, and securitization, including the guaranty fee and a surcharge then in place, about another half point. Those are historical estimates, not current October 2026 components. In its September 2026 agency MBS offering circular, Freddie Mac describes the note rate versus the security's pass-through coupon and the servicing and guaranty payments retained before the investor receives its coupon.
It also says principal can come back faster when borrowers refinance after rates decline. That early-return risk is why the investor's required yield can depart from a Treasury's even when both rates face the same inflation news.
There is an important distinction between a bond's coupon and its yield. A pool with a fixed pass-through coupon can trade above or below par. Its market yield changes with price and expected prepayments.
The MBS current coupon is a market shorthand for the yield associated with newly produced, near-par agency mortgage bonds; it is not the interest rate on a family's loan and cannot be read off Freddie Mac's survey. We do not publish a live current-coupon figure here because we could not verify an as-of-October-8 issuer quote. Quoting a coupon without its price and settlement context as though it were the MBS basis would pretend to measure something the evidence does not measure.
What widens the basis? Investors demand compensation for uncertain timing. When rates fall, homeowners can refinance and return principal to bondholders just as investors would prefer to keep the old higher-yielding cash flows.
When rates rise, refinancings slow, and the security's expected life can extend just as its price falls. Both outcomes complicate hedging. If volatility rises or buyers require a larger discount to take new mortgage supply, an issuer's MBS execution can worsen even with an unchanged Treasury yield.
Origination capacity, hedging, the mix of loans offered and competition among lenders can also change the quote passed through to a household.
That is why the word spread needs care. The difference between Freddie Mac's weekly PMMS average and a 10-year Treasury observation is a useful barometer, not the agency MBS yield spread itself. It blends the bond-market basis, fees, lender expenses, timing differences and borrower mix.
The Mortgage Bankers Association's October 7 survey release makes the timing problem plain: its average contract rate for conforming 30-year loans was 7.49% for the week ending October 2, with 0.84 points including the origination fee for its specified 80% loan-to-value loans. That 7.49% is not a correction of Freddie's 7.40% for October 8. They measure different application sets and periods, with different methods and point treatments.
The spread since 2019, not just this week
We matched each Thursday PMMS observation in FRED's MORTGAGE30US series against the 10-year Treasury observation in FRED's DGS10 series on that exact date, from January 2019 onward. For October 8 alone the DGS10 feed has no Thursday observation as of this writing, so the table and chart transparently pair October 8 PMMS with October 7 DGS10. We preserve the observation date in the underlying table instead of quietly substituting the 5.31% October 5 quote. Later DGS10 data can change this final pairing, but not the older matched dates.
| PMMS date | 30-year PMMS | 10-year yield | Difference |
|---|---|---|---|
| Dec 26, 2019 | 3.74% | 1.90% | 1.84 points |
| Dec 31, 2020 | 2.67% | 0.93% | 1.74 points |
| Dec 30, 2021 | 3.11% | 1.52% | 1.59 points |
| Dec 29, 2022 | 6.42% | 3.83% | 2.59 points |
| Dec 28, 2023 | 6.61% | 3.84% | 2.77 points |
| Dec 26, 2024 | 6.85% | 4.58% | 2.27 points |
| Dec 31, 2025 | 6.15% | 4.18% | 1.97 points |
| Oct 1, 2026 | 7.28% | 5.24% | 2.04 points |
| Oct 8, 2026* | 7.40% | 5.28%* | 2.12 points* |
*The October 8 PMMS value is paired with the latest available DGS10 observation, October 7, not a same-day yield. Rates and differences are percentage points unless marked otherwise. All other rows use matching PMMS and Treasury dates. The complete weekly matched table and the flagged final pairing were generated from those two FRED series.
The 2019 matched weekly observations averaged a 1.80-point difference in our calculation; 2021 ended at 1.59 points and 2023 ended at 2.77. Today's 2.12-point provisional reading is wider than that 2019 mean but narrower than the end-2023 example. That is a more honest reading than calling it an unprecedented distortion.
It also shows why a fixed formula such as Treasury yield plus two points cannot reliably price a mortgage in every cycle. Those are descriptive comparisons, not an estimated fair value for this week's bonds.
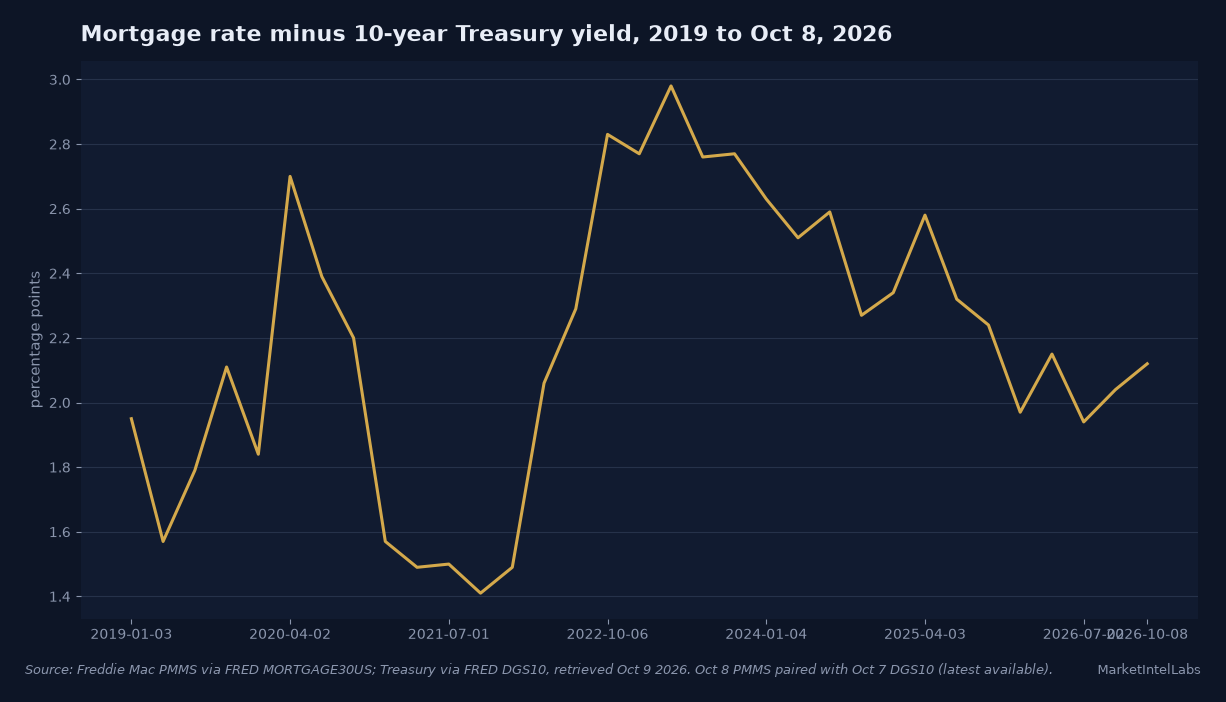
The chart samples the first available matched Thursday of each calendar quarter from 2019 through October 2026, then adds the separately flagged latest pair. It is plotted from our own weekly comparison table, not from a redraw of someone else's graphic. Read its high points as the full retail mortgage-to-Treasury difference.
They do not prove what share was caused by MBS volatility rather than changes in lender margins or fees. That allocation would require contemporaneous MBS price and current-coupon data as well as loan-level offers, which this chart does not contain.
What the Fed controls and what it does not
At its September 16 meeting, the Federal Open Market Committee said it raised the target range for the federal funds rate by a quarter point to 3.75% to 4.00%. Its statement described elevated inflation and a goal of restoring price stability. The funds rate is the overnight interbank policy rate.
It affects credit conditions, but it is not a 30-year fixed-mortgage menu or a promise about how long-term inflation will evolve. Treating a future quarter-point Fed move as a mechanical quarter-point mortgage move skips both the Treasury curve and the MBS market.
The Fed's September Summary of Economic Projections had a median projected appropriate federal funds rate of 4.1% at the end of 2026 and 4.1% at the end of 2027. That projection is a collection of individual participants' judgments under their own economic assumptions, not a committee promise. Its median was above the 3.8% end-2026 projection and 3.6% end-2027 projection shown in the June row of the same document. What matters for a long-term mortgage quote is not merely the next decision but whether investors revise their path for inflation, growth and future interest rates.
A cooler inflation report could lower the 10-year yield if investors conclude sustained inflation is less likely. But mortgage quotes might lag or fall by less if the MBS basis widens in a volatile market. Conversely, Treasuries could rise on firmer inflation even while an active buyer of MBS narrows the bond basis and partially cushions the mortgage rate.
Both scenarios are possible, not predictions. Watch the two legs independently: DGS10 for the benchmark and the PMMS-minus-DGS10 comparison for the broader mortgage gap. Neither tells a family whether its individual offer is competitive without the lender's annual percentage rate, points and closing-cost estimate.
MBA's October 7 release offers a real demand response to rising rates: total applications fell 4.2% week over week, its refinance index fell 8%, and the unadjusted purchase index was 15% below the comparable week a year earlier. MBA economist Joel Kan explicitly attributed the 7.49% contract rate in part to both higher Treasuries and wider spreads during rate volatility. His explanation is a market interpretation tied to that survey, not a numerical decomposition of Freddie's later 7.40%.
Fewer applications could lead lenders to compete harder on price; it could also reflect unaffordable payments with no immediate relief in bond funding. One week's volume cannot settle which effect wins.
Refinance arithmetic at 7.40%
A lower monthly payment is not automatically a worthwhile refinance. A homeowner who already owes $300,000 at an illustrative 8.00% with exactly 25 years left pays about $2,315 a month in principal and interest. If the same $300,000 balance were refinanced at 7.40% over the same remaining 25 years, the comparable payment would be about $2,198, saving $118 a month after rounding.
If the cash closing costs were $4,500, simple cash break-even would be $4,500 divided by about $117.95, or 38.2 months. These are calculated examples, not observed borrower offers.
That simple method answers one narrow question: how many monthly payment reductions recover the upfront cash. It assumes no cash-out, no changes in taxes or insurance, no additional principal, and no change to the remaining loan term. Rolling $4,500 of costs into the new balance makes the monthly payment higher and incurs interest on those costs; calling that transaction a zero-cost refinance conceals the financing.
A lender credit may instead trade a higher rate for less cash due at closing. Compare the lender's written loan estimates at the same points, loan size and term, then identify which fees are genuinely new and which prepaid taxes or escrow deposits would have arisen anyway.
Stretching the new $300,000 loan back to 30 years at 7.40% would cut its monthly principal and interest to about $2,077, around $238 below the old 25-year payment. But some of that drop comes from adding five years of repayment, not the 0.60-point rate change. Someone who expects to sell or refinance again before 38 months would not reach the simple break-even in the equal-term, cash-cost example.
Someone who stays longer might still need to compare lifetime interest, tax circumstances and the opportunity cost of $4,500. Nothing in a national average substitutes for a household's own loan estimate.
A purchase loan has different arithmetic. At 7.40%, the $400,000 example costs about $2,770 monthly in principal and interest. A 20% down payment on a $500,000 home would produce that $400,000 starting principal before purchase closing costs.
The payment is not the carrying cost of that home: local property taxes, homeowners insurance, maintenance and any HOA charges can change it materially. A lower mortgage rate could restore borrowing capacity, but if listings remain scarce or home prices rise, the total affordability gain can be smaller than the rate comparison suggests. That is the housing market's constraint, not a contradiction in the payment formula.
The dates that could change the picture
The next hard inflation checkpoint is the Bureau of Labor Statistics' September CPI release, scheduled for Wednesday, October 14 at 8:30 a.m. Eastern. The Fed calendar lists the next regular FOMC meeting for October 27 and 28. Neither event has happened at the time of this article, and neither guarantees the direction of a mortgage quote.
Ahead of both, the next Thursday Freddie Mac PMMS observation is due October 15 on its regular weekly cadence. Survey week, trade date and lender lock time are not identical clocks.
For the next print, compare the new PMMS average with 7.40%, then use a Treasury observation actually available for the matching date. A decline in both yield and spread would be a clearer improvement in funding conditions than a one-day Treasury rally on its own. If CPI pushes the 10-year higher but the PMMS rate stays flat, look for survey timing or narrowing in the broader gap before concluding lenders have insulated buyers.
If the Treasury drops while PMMS barely moves, check the next weekly observation and MBS market conditions before declaring that the Fed is irrelevant. The weekly spread is a signal to investigate, not a diagnosis by itself.
Our base reading is that a 7.40% mortgage average reflects both a high long-term benchmark and a mortgage gap that remains larger than it was at the end of 2021. A softer inflation path and calmer mortgage-bond trading could help both legs; stickier inflation and more uncertain prepayments could pull in the opposite direction. The decisive evidence will be the dated CPI, Treasury and weekly mortgage observations, not a promise about the next Fed vote.
Frequently Asked Questions
What are mortgage rates today for a 30-year fixed loan?
Freddie Mac's national PMMS average was 7.40% for the week of October 8, 2026. It is a weekly average of applications, not a live personalized lender quote. APR, discount points, credit, loan-to-value, property location and lock date all affect a borrower's actual offer. See Freddie Mac's survey for the latest posted weekly reading.
Why are mortgage rates higher than the 10-year Treasury yield?
A mortgage is typically sold into an MBS whose investor bears uncertain prepayment timing; originating and servicing the loan and providing an agency guaranty also cost money. The difference between Freddie's 7.40% October 8 mortgage average and FRED's latest available 5.28% October 7 Treasury yield was 2.12 percentage points. That whole gap is not lender profit, and comparing different days makes it provisional.
Will mortgage rates fall if the Fed cuts interest rates?
Not necessarily. A Fed cut directly changes a short-term target, while a 30-year mortgage depends on long-term bond yields, MBS pricing and lender costs. If investors expected the cut already or worry about long-term inflation, mortgage rates need not follow it down. Compare subsequent 10-year Treasury and PMMS observations rather than translating a policy move one for one.
When does refinancing a mortgage at 7.4% break even?
In our equal-term example, an 8.00% loan with a $300,000 balance and 25 years left saves about $118 a month when replaced with a 7.40% loan over 25 years. With $4,500 cash closing costs, simple break-even is about 38 months. A different existing rate, balance, loan term, fees or financed costs changes that answer; a 30-year reset can reduce the payment while increasing time in debt.
When is the next mortgage rate update?
Freddie Mac normally posts its PMMS each Thursday, so the next scheduled weekly observation after October 8 is October 15, 2026. The September CPI report is scheduled for October 14, and the Fed's next regular meeting is scheduled for October 27 to 28. Market quotes can move before the weekly survey posts, while a personal rate lock depends on lender terms.
This content is for informational purposes only and does not constitute financial advice. Past performance is not indicative of future results. Consult a qualified financial advisor before making investment decisions.
Get daily intelligence delivered
Create a free account for the Daily Brief every weekday and The Week Ahead every Sunday. No card required.