Mortgage Rates Hit 7.40% as Housing Demand Cools


Freddie Mac’s 30-year fixed mortgage rate reached 7.40% on October 8, up from 7.28% a week earlier and 6.30% a year ago. That 1.10 percentage-point annual increase now matters more than a modest change in sticker prices: on a $343,280 loan, principal and interest alone rise by about $252 a month compared with financing at 6.30%. The week of October 12 opens with a clear housing constraint: borrowing costs have moved sharply higher just as the fall market enters a quieter stretch.
The payment comparison uses Freddie Mac’s national average 30-year fixed rate and a $429,100 home price with 20% down, leaving a $343,280 loan, held constant to isolate the financing effect. At 6.30%, principal and interest are roughly $2,125 monthly; at 7.40%, they are about $2,377. That is approximately $252 more per month before taxes, insurance or other costs. Taxes, insurance, mortgage insurance, down payment and local price differences are excluded. This is a comparison, not a household quote, and it shows why even a flat home price can become less affordable when rates jump.
Demand is the first pressure point
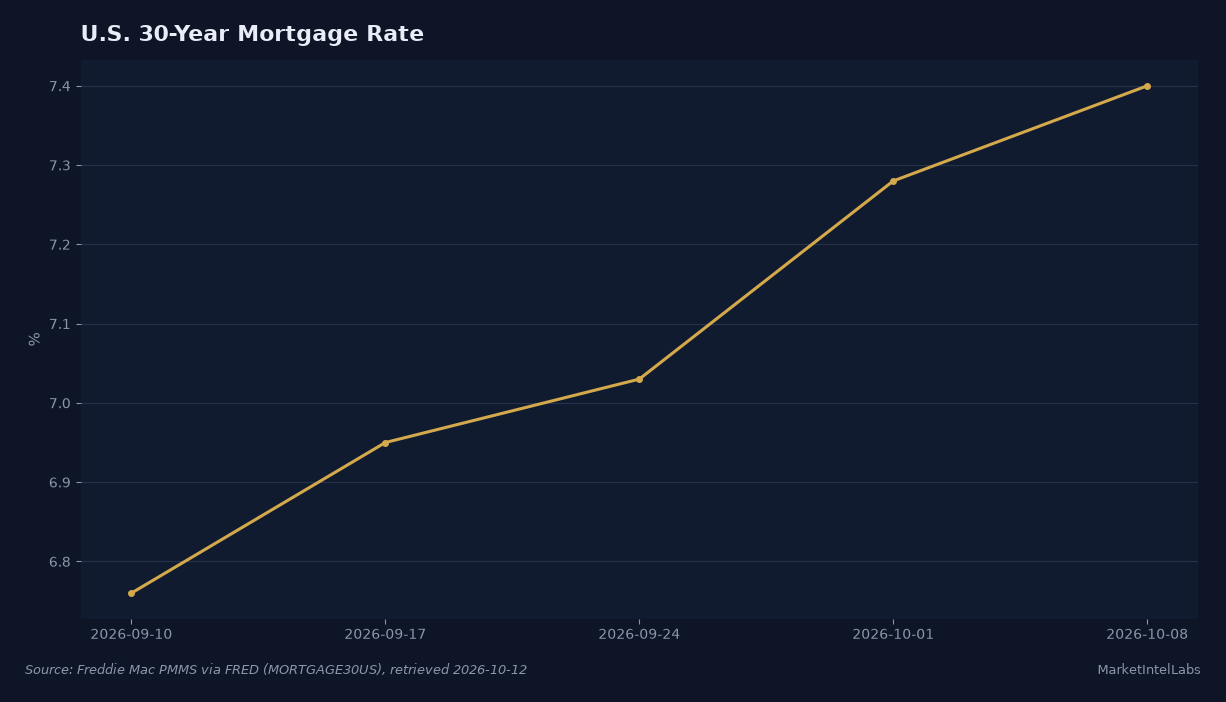
Freddie Mac’s weekly series rose from 6.76% on September 10 to 7.40% on October 8. The latest increase is not an isolated wobble: the average added 64 basis points in four weeks. The Mortgage Bankers Association’s October 7 release, covering applications for the week ending October 2, found total applications down 4.2% week over week. Purchase applications slipped 2% and were 15% below the same week a year earlier, while refinancing fell 8% and stood 56% below its year-ago level.
Related reading: Housing Week: More Listings, But Buyers Still Face a Payment Wall.
That is the clearest near-term transmission channel. Buyers can delay a search, reduce their budget, or seek a lower-priced home; existing owners with cheaper mortgages have little refinancing incentive. Higher rates can therefore thin transactions before they force broad price declines. The latest MBA survey is a weekly measure and can be volatile, but it aligns with the affordability arithmetic rather than contradicting it. Compared with 6.76% on September 10, the average rose 64 basis points in four weeks. It was 6.30% on October 9, 2025, 110 basis points below this year’s October 8 rate.
The supply side offers a partial counterweight. NAR’s August existing-home sales report recorded 3.98 million annualized sales, down 2.0% from July and 1.2% from a year earlier. Inventory reached 1.62 million homes, up 3.2% on the month and 5.9% year over year, equal to 4.9 months of supply. That gives buyers more room to compare without indicating an abrupt national glut. The median existing-home price was $422,400, 2.0% above a year earlier. Rising inventory has not yet translated into a lower national price.
Related reading: Mortgage Rates Reach 7.40% as Housing Completions Fall.
Construction is uneven, not collapsing
The latest Census and HUD release, published September 17 for August, showed privately owned housing starts at a 1.275 million seasonally adjusted annual rate, 2.6% below July and 1.2% below August 2025. Permits were 1.394 million, down 2.7% from July but 3.5% above a year earlier. Single-family starts, however, increased 7.6% from July to 918,000. The mix matters: the monthly headline weakened, but permits remain above last year and the single-family component rose.
Completions were the softer supply signal. August completions fell 11.9% from July to a 1.128 million annual rate and were 27.1% below a year earlier. One month cannot establish a lasting shortage, and Census cautions that several months are needed to identify a trend in these volatile series. Still, fewer completed homes mean a cooler flow of new inventory even as existing listings have increased.
Related reading: Fannie Mae Mortgage Applications Fall 14.3% as Rates Rise.
Builders’ September survey adds evidence of strain. NAHB’s Housing Market Index fell three points to 32, its lowest since September 2025. Current sales conditions registered 35, future expectations 37, and prospective-buyer traffic 23. All are below 50, the point at which more builders describe conditions as good than poor. NAHB attributed weakness to higher rates and costs, and said 42% of builders rated lot availability poor. The survey is not a sales count, but it shows that new construction faces both demand and cost limits. Incentives also increased: 38% of builders cut prices in September, up from 35% in August, while the average reduction held at 6%; 66% used sales incentives, versus 63% in August. The price-cut share is a gauge of builder strategy, not a measure of home prices across the resale market.
The data do not point in one direction. August single-family starts improved, permits rose year over year and existing inventory is growing. If rates stabilize, buyers may return to a market with more listings, and builders could keep projects moving where demand is strongest. But the October 8 rate level, the decline in purchase applications and low builder confidence make a quick rebound difficult to establish from these data.
What to watch this week
NAR is scheduled to release September existing-home sales on Tuesday, October 13. Census and HUD list September new residential construction for October 20; their latest published report remains August. Freddie Mac’s next weekly mortgage-rate release is October 15. Together, the releases separate current demand from the supply pipeline. Stronger sales alongside growing inventory would suggest buyers are adapting, while a weak transaction count would fit the application data. For construction, permits and single-family starts will matter more than one noisy total-starts reading.
For household affordability, the next rate observation is more actionable as a measurement than as a forecast: compare the weekly mortgage average with the home price and available inventory, not the price index alone. Higher rates raise the monthly cost; additional listings can improve choice and bargaining power, but cannot erase the financing shock for a buyer whose budget is already stretched. Tuesday’s resale report and the October 20 construction release should clarify how those forces are interacting.
This content is for informational purposes only and does not constitute financial advice. Past performance is not indicative of future results. Consult a qualified financial advisor before making investment decisions.
Get daily intelligence delivered
Create a free account for the Daily Brief every weekday and The Week Ahead every Sunday. No card required.