commodities

Gold, Silver Momentum Confirmed, Oil Prices In Hormuz Risk

Published August 25, 20262 min read
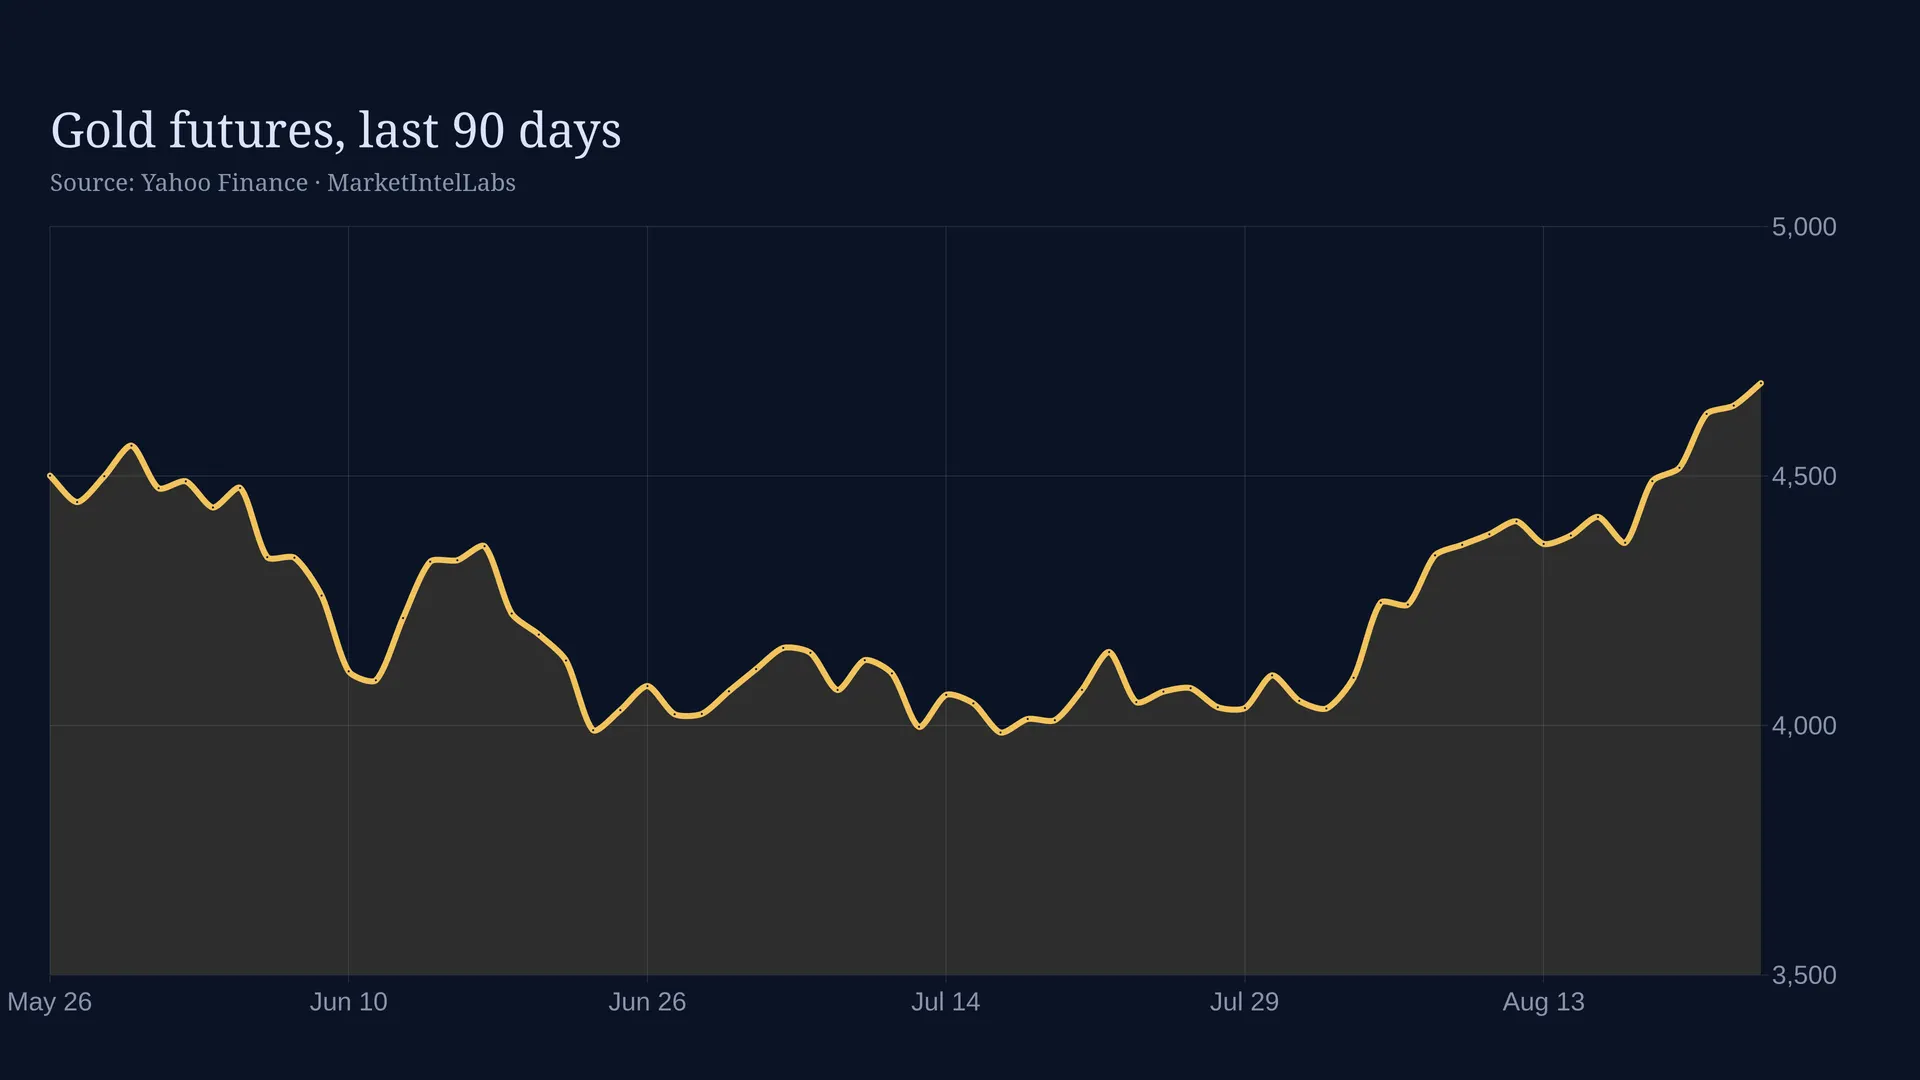
Line chart of Gold futures price over 90 days on a dark background

Gold closed at $4,694.00 on Tuesday, up 15.33% over the trailing month, and the positioning data behind that move looks like conviction, not chasing. CFTC data for the week ended August 18 shows managed-money net longs in COMEX gold at 222,189 contracts, up 4,249 from the prior week. That is a measured build in a market that just ran from a $4,033.70 low on August 3, and it is the kind of steady accumulation that tends to mark a trend rather than a blow-off.

For more on gold and silver momentum, see our analysis of bitcoin institutional flows.

Silver tells a different story at $67.84, up 16.35% for the month and briefly tagging $69.99 intraday. Speculative positioning barely budged, down 21 contracts to 23,625. Price is outrunning the paper market here, which usually means industrial demand and physical tightness are doing the work rather than momentum funds piling in. That is constructive: there is room for spec money to show up later instead of an already-crowded trade that needs to unwind first. I'd watch $70 as the near-term test and $63-65 as support if profit-taking hits.

Read about recent market rotations in tech under pressure.

A softer dollar is helping both metals. The broad trade-weighted index (FRED DTWEXBGS) fell from 119.18 to 118.06 over ten trading days, a 0.9% drift that removes a headwind rather than a reversal. Add China's roughly 40-tonne gold reserve addition in June, its second-largest monthly buy since early 2025, and the central-bank bid underneath this market still looks intact.

For more on energy markets, see our coverage of energy lagging tech.

Oil is the mirror image. WTI sits at $84.58, down almost 10% over three months on soft demand, yet CFTC data shows a 22,894-contract jump in net managed-money longs to 122,090, the sharpest positioning shift of the four commodities I track. Iran's threat to close the Strait of Hormuz, a chokepoint for roughly a fifth of global seaborne crude, is pulling in length even while the demand tape stays weak. Hormuz threats have historically produced headline volatility more often than sustained supply disruption, since a closure would also choke off Iran's own exports, so I want to see actual tanker transit data before treating $84.58 as a floor.

Watch the dollar index for a bounce back above 119, which would remove gold's tailwind fast, and watch tanker traffic through Hormuz rather than the rhetoric around it. Both markets have moved further than the fundamentals alone would justify, and that cuts in both directions.

This content is for informational purposes only and does not constitute financial advice. Past performance is not indicative of future results. Consult a qualified financial advisor before making investment decisions.

Explore our ongoing our gold coverage for deeper insights into precious metals.

Get daily intelligence delivered

Create a free account for the Daily Brief every weekday and The Week Ahead every Sunday. No card required.