Freddie Mac PMMS Explained: 7.40% Before October 22 Update


The Freddie Mac PMMS is a weekly average of mortgage rates drawn from eligible purchase applications, not a Thursday morning quote or a promise that a buyer can borrow at the published number. At 10:00 UTC on October 22, the latest published Freddie Mac reading is 7.40% for a 30-year fixed mortgage and 6.71% for a 15-year loan, both dated October 15. The next result is scheduled for noon Eastern today. For a $320,000 loan, 7.40% implies about $2,216 a month in principal and interest; the 6.27% rate Freddie Mac reported a year earlier implies about $1,974.
That $241 monthly gap is the housing story even before taxes, insurance or maintenance.
That distinction matters this morning. The new number cannot be inferred from yesterday’s headlines or a quote seen on a lender’s website. Our report on the October 21 applications release covers a different survey: MBA found applications fell 5.3% in the week ending October 16 even as its own conforming contract rate slipped to 7.41%. PMMS asks a narrower question about eligible applications through October 21.
Read the two together, but do not merge the rates or reporting windows.
How the weekly mortgage benchmark got here
Freddie Mac has published a 30-year rate series since 1971. For most of its history, its Primary Mortgage Market Survey asked a sample of lenders for the rates and points on their popular products. That description is still repeated in conversations about mortgage news, but it no longer describes the current measurement. In November 2022, Freddie Mac switched the benchmark to rates associated with thousands of applications submitted through its Loan Product Advisor system.
The agency explains the change in its methodology research note.
The switch is more than a technical footnote. The earlier lender survey captured a quoted rate for a representative loan. The newer application-based method draws from borrowers actively seeking purchase financing through lenders that submit applications to the system. That makes the observation more closely tied to live application activity, but it still does not follow every loan through closing.
A locked rate, a funded loan and an advertised online quote are three different observations. None is interchangeable with the PMMS weekly average.
Freddie Mac’s current rate page and FAQs put the October 15 30-year rate at 7.40%, unchanged from October 8, and the 15-year rate at 6.71%, down from 6.73%. The prior-year comparison on that page is 6.27% for the 30-year loan. A flat week therefore does not mean affordability is flat over a year. At the same illustrative $320,000 principal, our standard 360-payment amortization calculation rises from roughly $1,974 at 6.27% to $2,216 at 7.40%.
The example fixes the principal to isolate the effect of the rate, not to describe a median buyer.
The path between those endpoints also matters. From Freddie Mac’s downloadable weekly history, the 30-year series stood at 6.66% on July 30, 6.76% on September 10, 7.03% on September 24 and 7.40% on both October 8 and October 15. At a fixed $320,000 balance, 6.66% produces about $2,056 in monthly principal and interest. The move to 7.40% adds roughly $159 per month.
It takes a larger income or a smaller loan to absorb that difference; a seller’s modest concession on the listing price may not offset it.
There is a second affordability constraint: the house price is not fixed in the actual market. A smaller home can keep a payment down, while a builder’s temporary buydown changes early cash flow without changing PMMS. The national print cannot measure affordability in a particular county. Rate, price, down payment and local tax bill must be assessed together.
What enters the PMMS calculation
The present survey starts with loan applications submitted through Freddie Mac’s Loan Product Advisor, not a poll of mortgage shoppers. Its methodology note describes filtering for new or updated purchase applications, removing bad and duplicate records and selecting the latest qualifying submissions. Freddie Mac then calculates a national average of the selected mortgage rates. The official description says average, not median; calling the headline a national median would misstate the published methodology.
Nor does a borrower submit a vote directly to Freddie Mac merely by searching for a mortgage online.
The filters are strict. Freddie Mac’s 2022 methodological specification describes an owner-occupied, one-unit, conventional conforming purchase loan in the contiguous states or Washington, D.C., an origination loan-to-value ratio from 75% through 80% and a FICO score of at least 740. The conforming ceiling changes with the year; the dollar limit cited in that historical methods note applies to 2022, not automatically to today. A low-down-payment first-time buyer, a jumbo borrower, or someone buying in Alaska is not represented by the same selected loan profile.
Consider the arithmetic before reading the next headline as an offer. On a $400,000 home, a $320,000 mortgage corresponds to 80% loan-to-value, with $80,000 down. At 7.40%, the principal and interest calculation is about $2,216 per month for a 30-year term. Property taxes, insurance, association fees and maintenance can lift the cash needed each month.
The $80,000 down payment is not a prediction about what households actually bring to closing; it is a transparent example that approximates the top end of the survey’s loan-to-value band.
PMMS groups applications received from the previous Thursday at 12:00 a.m. Eastern through Wednesday at 11:59 p.m. Eastern, then posts the reading on Thursday at noon Eastern, according to Freddie Mac’s timing FAQs. The published 2026 release calendar maps today’s October 22 publication to a window that began October 15 and ended October 21.
At our 10:00 UTC writing time the scheduled noon Eastern publication is still hours away. The important clock is the underlying application week, not the minute a news alert arrives.
Suppose Treasury yields climb sharply Thursday morning. A lender can reprice a loan offer that day, but the PMMS being released at noon mostly reflects applications through Wednesday night. Conversely, a week of lower offers that ended Wednesday could pull the survey down even if Thursday morning rates turn higher. This is a measurement lag, not an error.
A borrower facing a time-limited contract needs a current dated Loan Estimate; the historical survey cannot preserve a quoted rate for them.
The points treatment is another trap. Freddie Mac says it stopped reporting average fees and points in November 2022 because lenders are not always required to provide those fields in the Loan Product Advisor submissions. That does not mean the underlying mortgages have zero upfront costs. The Consumer Financial Protection Bureau explains that discount points can lower the interest rate in exchange for cash paid at closing.
A lender credit can reverse that trade: lower cash outlay now for a higher rate. Comparing a PMMS percentage with a quoted loan that includes points, without reading the fee line, hides the trade.
A loan with an advertised 7.25% coupon and expensive discount points can cost more over a short holding period than a 7.40% offer without them. The actual answer depends on loan balance, loan term, lender charges and how long the buyer holds the loan. The CFPB advises borrowers to compare Loan Estimates for the same loan amount and type, including origination charges, lender credits and the five-year borrowing cost. The PMMS does none of that individualized work.
It measures a market reference under stated filters.
The chart: a steady October reading after a rising late summer
The selected weeks in the original chart below come from Freddie Mac’s published PMMS history file. The chart deliberately ends October 15, the last posted observation available when this article was prepared. Between July 30 and October 15 the 30-year reading rose from 6.66% to 7.40%, a 0.74 percentage-point change. Seven-day readings do not move in a smooth line, so the eight dated observations shown are selected waypoints rather than a claim that unshown weeks had no changes.
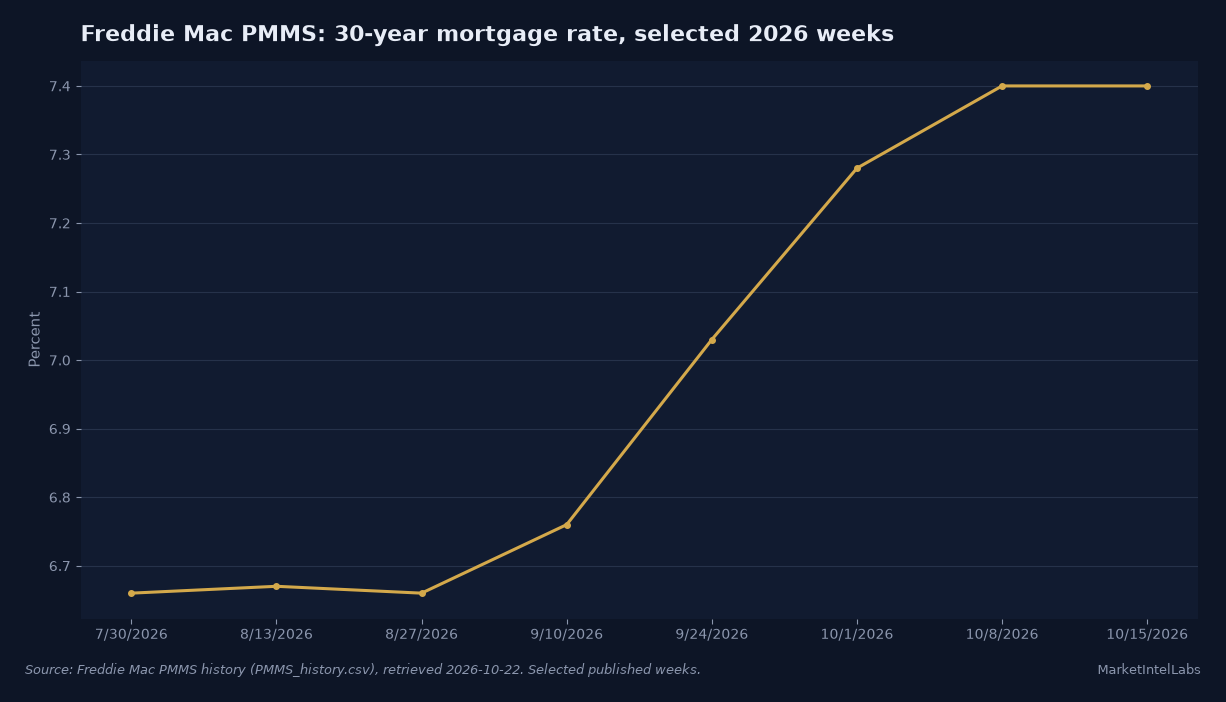
The flat 7.40% between October 8 and October 15 may be the first sign of a pause. It may also be a brief shelf in a longer repricing. The PMMS alone cannot tell which. Read the next observation alongside the number of purchase applications and the cost of financing a home at the local price point.
If today’s rate eases but qualified borrowers still pull back, financing cost is not the only bottleneck. If it climbs again while inventory remains scarce, an already narrow buyer pool has less room to stretch.
Why PMMS, Treasury yields and MBA disagree
A 10-year Treasury yield is the return on a government security, not the interest rate charged on a household mortgage. Mortgage-backed security pricing, expected prepayments, lender capacity, servicing costs and credit terms sit between that benchmark and the loan offer. A change in Treasury yields can move mortgage pricing without passing through one for one. It is a mistake to subtract the Treasury yield from a PMMS reading and treat the remainder as a single stable lender profit margin.
The instruments have different risks, cash flows and observation times.
There is also a calendar mismatch. A daily Treasury benchmark reflects a trading day. The PMMS combines eligible applications over seven calendar days and publishes afterward. Even a perfectly calculated spread can widen or shrink because the two legs were observed over different windows.
The cleaner comparison is a dated sequence of each series with the windows and borrower profile identified, not a Thursday intraday Treasury tick beside last week’s Freddie Mac number.
MBA’s October 21 weekly applications release illustrates the difference. MBA reported a 7.41% average contract rate for conforming 30-year fixed applications, down from 7.50%, for the week ended October 16. It also reported average points, including the origination fee, declining from 0.83 to 0.75 for loans at 80% loan-to-value. Freddie Mac’s 7.40% figure covers an earlier Thursday-through-Wednesday window and does not publish points.
A one-basis-point distance between their headline rates is not evidence that one organization measured the other incorrectly.
The demand side of the MBA release is more sobering than that small rate difference. The seasonally adjusted purchase application index fell 7% from the previous week; the unadjusted purchase index was 18% below a year earlier. Those measures describe a survey of application volume, not completed sales or the number of buyers who qualify at the Freddie Mac benchmark. But they make a useful test of the proposition that a fractional rate decline will revive demand immediately.
This week’s data do not support that proposition.
Our September housing starts analysis looks further along the chain, at construction rather than loan applications. A mortgage rate change can affect a buyer’s search and a builder’s pricing assumptions before it appears in starts. The surveys are not synchronous, and a one-week PMMS movement should not be treated as a forecast of next month’s permit count.
Housing supply can weaken the apparent benefit of a lower rate. If a price reduction brings more buyers into a market with too few available homes, sellers may regain pricing power. If builders are carrying more unsold finished homes, the same financing relief may instead help clear that stock without increasing prices. The national PMMS cannot settle the local inventory question.
It is the financing input to a larger affordability equation, not a measure of the entire housing market.
What the primary documents establish
The Freddie Mac release page establishes the last published 30-year and 15-year averages, the application-based source and the Thursday publishing rule. The methodology note identifies the 2022 change from lender polling to application records and the borrower filters. The official calendar establishes the October 22 date and the October 15 through October 21 measurement period. Together they rule out describing today’s not-yet-published rate as an observed fact.
The weekly data file backs the plotted path rather than a recollection of rate headlines. The MBA release gives a distinct contemporaneous measure of mortgage applications, a different rate and reported points. The CFPB comparison guide explains which numbers belong on a borrower’s own Loan Estimates. These are complementary documents, not competing estimates of one perfectly defined national mortgage price.
There are limits even within Freddie Mac’s selected population. Only loans submitted through its specified application channel and meeting the filters enter the calculation. Local underwriting, property type, credit profile and lender pricing can all diverge. A household should not interpret being offered a rate above 7.40% as proof that a lender has made an error, or a rate below it as proof of a better deal after fees.
A national average says where a slice of the market has been, not what every applicant can obtain next.
In the optimistic case, a lower PMMS reading over several consecutive weeks reduces monthly payment pressure while sellers adjust prices and builders offer more completed inventory. That would create more qualified demand without asking buyers to rely on temporary subsidies. The harder case is a rate that stays high, coupled with scant resale supply and prices that do not fall enough to restore buying power. The October 21 MBA decline argues against assuming that one modest improvement in rates settles the issue.
Neither scenario follows mechanically from a single Thursday number.
What is dated next
The next Freddie Mac publication is scheduled for Thursday, October 22, at noon Eastern, covering applications through Wednesday, October 21. Freddie Mac’s calendar then lists Thursday, October 29, for the following cycle. The most useful day-of comparison will be the new 30-year and 15-year readings against October 15, and whether the move persists in the next weekly window. Do not confuse a publication time with the time a borrower’s rate can still be locked.
For the demand follow-through, watch the next MBA weekly application report rather than inferring purchase activity from the rate alone. Later housing construction and sales releases can reveal whether financing changes reached actual transactions, but each has its own lag. Our analysis of September pending sales is a reminder that signed contracts and mortgage applications sample different moments in the buying process. An improving benchmark alongside weak contracts would be evidence that price and available supply still matter.
This week’s practical reading is therefore conditional. A lower October 22 PMMS number would mean qualifying purchase applications carried a lower average rate in the completed measurement week. It would not mean every buyer’s monthly cost fell, that points disappeared, or that builders started more homes overnight. The decision-relevant comparison is a dated loan offer including fees and cash to close against a realistic local property price.
The survey tells us when the financing current changed; the household math shows whether it was enough.
Frequently Asked Questions
What is the Freddie Mac PMMS?
The Primary Mortgage Market Survey is Freddie Mac’s weekly U.S. mortgage-rate measure. Since its 2022 methodology change, its published 30-year and 15-year fixed-rate averages draw on eligible purchase applications submitted to its Loan Product Advisor system. It is not a nationwide listing of lender quotes and does not guarantee that any individual applicant will receive the average rate. The official PMMS page carries the latest observation.
When does Freddie Mac release PMMS on Thursday?
Freddie Mac says it normally posts PMMS at noon Eastern on Thursday, or Wednesday when a U.S. holiday falls on Thursday. The applications behind a normal Thursday publication span the previous Thursday through Wednesday. The 2026 calendar schedules the October 22 release for applications from October 15 through October 21. At this article’s 10:00 UTC writing time, that release remains ahead.
Is Freddie Mac PMMS the rate I can get today?
No. It is an average for a selected loan profile and a recently completed application window. A current offer depends on the borrower, property, lender, lock timing and upfront fees. The CFPB says to compare dated Loan Estimates on payment, origination costs, credits, cash to close and five-year borrowing cost.
A benchmark is a useful reference, not a personalized quote.
Does the PMMS mortgage rate include points or closing costs?
The current publication does not report average fees or points. Freddie Mac says those fields are not consistently required in its underlying applications. That omission does not make closing costs zero. The CFPB points guide explains why paying upfront can lower a quoted coupon and receiving a lender credit can raise it.
Check the actual Loan Estimate before comparing two offers.
Why is PMMS different from the MBA mortgage rate?
The surveys use different observation windows, samples and cost disclosures. MBA’s October 21 report described a 7.41% conforming 30-year contract rate and 0.75 points for the week ending October 16; Freddie Mac’s last available PMMS was 7.40% on October 15 and published no points. A small difference should be read as a difference in measurement, not proof that either is a current offer for every household.
This content is for informational purposes only and does not constitute financial advice. Past performance is not indicative of future results. Consult a qualified financial advisor before making investment decisions.
Get daily intelligence delivered
Create a free account for the Daily Brief every weekday and The Week Ahead every Sunday. No card required.