10-Year Treasury Yield at 5.27%: What Keeps It Above 5%


The 10-year Treasury yield was 5.27% at the October 6 close in the Treasury's daily par yield data, down from 5.31% on October 5 but 26 basis points above its September 16 reading of 5.01%. That is the latest official daily observation available for this article, not a live October 7 quote. The important point is that the long rate stayed above 5% even after a modest pullback. A lower one-day print is not yet a change in the borrowing-cost regime.
Why is a 5.27% 10-year yield consequential? It is a reference rate for the cost of money over years, not just until the next Federal Reserve meeting.
Related reading: The Fed's 25bp Hike to 4% Puts Cash on Top Until August PCE.
It can remain high even if traders mark down the odds of another near-term rate increase. The question for borrowers is whether the persistence comes from expected short rates, compensation for inflation, or an additional premium for holding a bond whose price can fall before maturity. Those explanations have different implications, and the daily yield alone cannot separate them.
How the 10-year Treasury yield got here
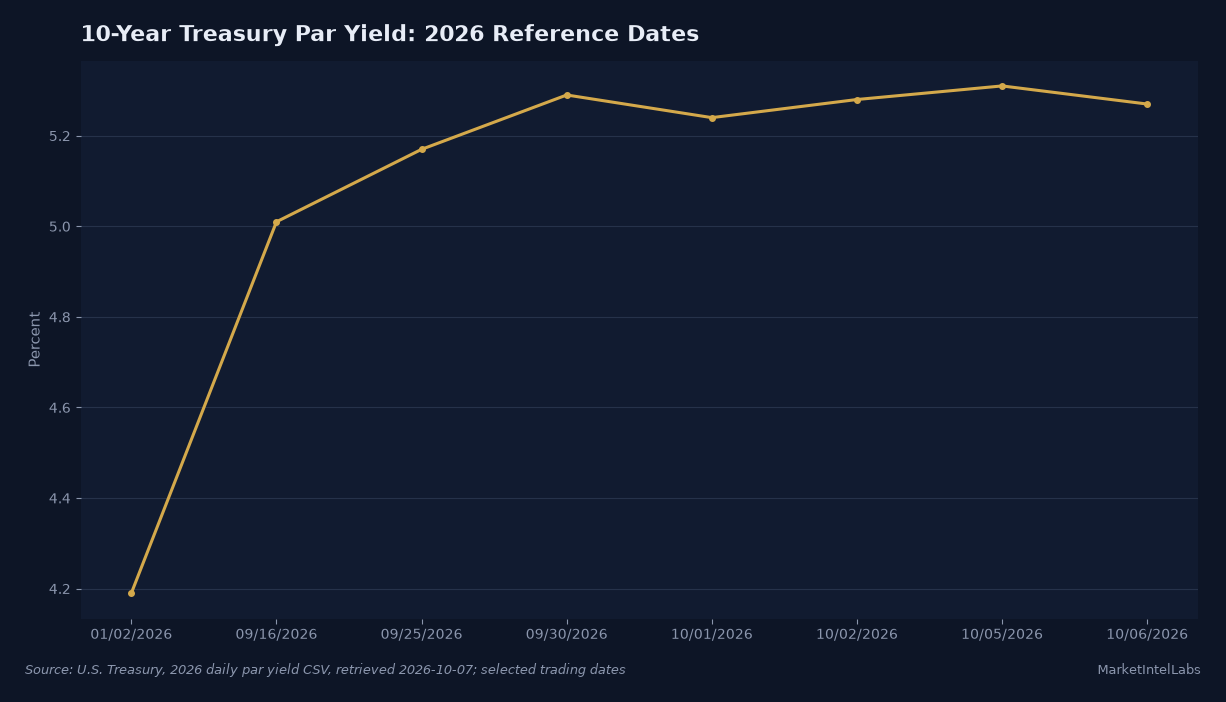
The Treasury's 2026 daily par yield file puts the 10-year rate at 4.19% on January 2. It was 5.01% on September 16, the date of the Fed's latest policy decision; 5.17% on September 25; and 5.29% on September 30.
For the broader framework, see our Fed policy coverage.
October then opened at 5.24% on the first, reached 5.31% on the fifth, and eased to 5.27% on the sixth. These are closing daily observations, not intraday highs. The climb from January 2 to October 6 was 108 basis points, with 26 basis points of that move occurring after the September Fed meeting.
The short end tells a different story over that post-meeting interval. In the same Treasury file, the two-year par yield was 4.74% on September 16 and 4.79% on October 6, a five-basis-point rise. The difference between the 10-year and two-year yields widened from 27 to 48 basis points.
Subtracting two Treasury observations is straightforward; interpreting the difference requires more care. The widening does not prove a single cause. It does tell us that a story about imminent Fed decisions alone cannot explain the size of the move in the longer maturity.
That distinction matters because the September 16 FOMC statement was not a promise of lower rates. The Committee said it raised the target range by a quarter percentage point to 3.75% to 4.00%, by a 12 to 0 vote.
It described activity as expanding at a solid pace and inflation as still elevated. The language said its action would support a return to the 2% goal. It did not specify a timetable for reducing the target range.
For a wider account of how the long end has resisted a softer inflation print, our earlier analysis of the August PCE release and the 10-year yield provides useful background. The comparison here goes a step further by separating movements at two and 10 years and identifying what the official Treasury series can, and cannot, say about their causes. A day of falling yields after October 5 should not erase the larger post-meeting change.
Why the 10-year rate can move without a new Fed decision
A Treasury yield is the return implied by a bond's price and cash flows. When the market price of an existing bond falls, its yield rises. A 10-year yield therefore reprices as investors revise what they expect to earn from future short-term rates and what extra compensation they demand for the uncertainty of owning a longer bond.
The New York Fed's term-premia research page describes that division explicitly: an expected path of short rates plus a term premium for interest-rate risk. The premium is not observed directly. It is estimated with a model, and this article does not claim a numeric premium from the observed yields.
That is the core analytical restraint in this story. A 26-basis-point increase in the 10-year rate after September 16 is a measured change in the Treasury's par yield.
It is not automatically a 26-basis-point rise in inflation expectations, a 26-basis-point change in Fed expectations, or a 26-basis-point jump in the term premium. Those pieces can move in opposite directions on the same day. Assigning the entire change to one of them without a separately dated series would turn a plausible narrative into an unsupported measurement.
The yield also needs a precise definition. The Treasury's yield curve methodology says its official par curve is fitted from indicative bid-side quotations for the most recently auctioned securities. The New York Fed obtains the inputs at or near 3:30 p.m.
Eastern on trading days; Treasury uses a monotone convex method to derive par rates across maturities. These are not the coupon on every outstanding note and are not a lender's promised mortgage or corporate borrowing rate. A daily par rate is best treated as a consistent market benchmark.
From that benchmark, higher yields can reach households and companies through several channels. Fixed-rate borrowing costs may rise when lenders reset their offers against Treasury benchmarks and spreads. Existing fixed-rate borrowers do not see their contract coupons change simply because the Treasury curve moves.
Bonds already owned at a lower coupon may lose market value when comparable new yields rise, even though their contractual cash flows have not changed. That price effect is larger for longer-duration bonds, all else equal. None of these relationships says a specific loan or security must move point for point with the 10-year note.
There is another useful distinction between the bond market and the Fed. The Fed controls a target range for overnight federal funds transactions; it does not set a daily closing 10-year par yield.
Markets can price the expected policy path into the long rate before a decision, then change their view when employment, inflation or Treasury supply information arrives. An investor focused only on the next meeting risks missing a longer-horizon repricing. The same spread can widen because the two-year yield falls, the 10-year rises, or both; the September 16 to October 6 data show a larger rise at 10 years.
Inflation is one possible contributor, but here the relevant Bureau of Economic Analysis August PCE release offers a mixed signal rather than a clean verdict. Headline PCE prices increased 0.3% in August from July and 3.4% from a year earlier; core PCE increased 0.2% on the month and 3.0% over 12 months.
Real consumer spending rose 0.6% on the month. A slower core monthly change does not erase the higher annual rate or tell us how much of a bond-yield change reflects inflation compensation. The consumption figure also complicates a simple narrative that softer inflation must bring immediate rate relief.
Our earlier explanation of 10-year term-premium mechanics sets out that distinction in more detail. The working interpretation in this feature is narrower: the official curve steepened between the September decision and October 6, while the Fed's policy range itself had not changed again. Longer-horizon compensation deserves attention, but the available par-yield observations do not identify its numerical contribution. This is a hypothesis to test with the next observations, not a solved decomposition.
The original chart: selected 2026 closing dates
The chart plots eight selected trading dates from Treasury's 2026 daily file. Its points include the first trading day of the year, the September Fed decision, and every trading day from September 25 that is marked on the plot.
Lines connect those selected observations for readability; they do not show every intervening session or imply a steady daily climb. The comparison table beneath it preserves the key prints and makes the selection transparent. No consensus forecast belongs in a daily Treasury yield series because there is no single official consensus closing yield.
| Trading date | 10-year par yield | Two-year par yield | 10-year minus two-year |
|---|---|---|---|
| January 2, 2026 | 4.19% | 3.47% | 72 basis points |
| September 16, 2026 | 5.01% | 4.74% | 27 basis points |
| September 30, 2026 | 5.29% | 4.88% | 41 basis points |
| October 5, 2026 | 5.31% | 4.84% | 47 basis points |
| October 6, 2026 | 5.27% | 4.79% | 48 basis points |
These arithmetic spreads are our calculations from the Treasury's dated par curve. They are not a forecast of a recession, an estimate of the term premium, or a threshold that automatically triggers a mortgage-rate reset.
For orientation, January's 72-basis-point spread was wider than October's 48 basis points even though October's 10-year yield was much higher. Curve shape and the absolute level of rates answer different questions. One concerns the relative price of borrowing across maturities; the other concerns the level that longer-term contracts might reference.
What the primary documents actually say
Start with the Fed's September Summary of Economic Projections. Its median participant projected a 4.1% federal funds rate at the end of 2026 and again at the end of 2027, then 3.9% for 2028.
The median 2026 PCE inflation projection was 3.7%, and the median 2026 unemployment projection was 4.1%. Those values are conditional assessments submitted by individual officials, not an agreed Committee forecast and not a promise that the overnight rate will follow the medians. A 10-year yield above 5% should not be compared mechanically with a single end-of-year funds-rate dot.
The statement and projections also answer different questions. The September statement records the action actually taken and the Committee's contemporaneous assessment; the projection table describes each participant's view of appropriate policy under that participant's assumptions. The latter does not specify how investors should value a 10-year bond, which spans far more than the projection horizon's next policy meeting. A long yield can remain elevated even if the Committee later holds the policy range steady, provided other components of long-rate pricing change.
The BEA's August personal-income release adds a demand-side cross-check. The published 0.6% monthly increase in real consumer spending contrasts with the idea that every household was already retrenching, while core PCE's 0.2% monthly rise points to less immediate price pressure than the 3.0% annual core rate alone suggests.
Neither one month of spending nor one inflation release settles the coming policy path. The Fed could emphasize inflation persistence, while investors respond more to the eventual cost of financing long-duration assets. Both readings are consistent with the documents; the exact balance cannot be read out of a single yield.
For an alternative view, the decline from 5.31% on October 5 to 5.27% on October 6 may be the start of a longer reversal. The curve can also steepen while both yields fall if the short end falls faster.
On October 6, the 10-year fell four basis points and the two-year fell five, leaving the spread slightly wider. That is a one-day observation, not evidence that inflation risk has vanished. If successive Treasury closes push the 10-year toward its September 16 value of 5.01%, the assertion that long-rate pressure persists would need to be revised.
The opposite case is equally concrete. If the 10-year returns above the October 5 close of 5.31% while two-year yields remain near 4.79%, a longer-maturity source of pressure deserves closer examination.
It would still be necessary to inspect separately published real yields, inflation compensation and a term-premium model before naming the driver. The New York Fed explicitly calls its term-premium estimates models rather than directly observed market prices, and notes that they are not official FOMC estimates. A model reading is useful evidence, not a statement of what the Committee intends.
Long yields also affect how readers interpret stock and housing headlines, even though this is a rates feature. A higher discount rate can reduce the present value of distant expected cash flows; lenders often quote spreads above government benchmarks when offering long-duration credit.
Those are channels, not forecasts of particular equity prices or mortgage quotes. Our related duration analysis at a 5.28% 10-year yield explores the sensitivity of existing bonds. What matters here is separating a benchmark that has already moved from consumer terms that will be observed on their own timetable.
What is dated next
The Fed's published FOMC calendar lists the September 15 and 16 meeting with its statement and projections, but, as checked before today's planned release, it does not yet display the minutes text for that meeting. The same calendar says minutes of regularly scheduled meetings are usually released three weeks after the policy decision and lists the next policy meeting for October 27 and 28. The desk's dated events schedule places the September minutes at 18:00 UTC on October 7. This article is written before that time: it makes no claim about what the unpublished minutes contain.
When those minutes appear, the question is whether discussion of inflation persistence, labor conditions and the likely policy path confirms the published statement's tone or adds a distinction investors had missed. Read the actual minutes before assigning a view to participants. Compare any change in the subsequent two-year and 10-year Treasury closes with the October 6 benchmarks of 4.79% and 5.27%, respectively. One trading session's reaction can reverse, so the size and persistence of a move matter more than the first headline.
For the 10-year benchmark, the next official Treasury close is the simplest check. Below 5.01%, the entire rise since the September 16 meeting would be gone on a closing basis; above 5.31%, the October 5 close would be surpassed.
Those are historical comparison levels from the sourced series, not predictions, trading instructions or claims that a market will respect a line. Between them, the question remains whether the curve's shape changes because two-year yields move more quickly than the long end. The next scheduled policy meeting is October 27 and 28; daily Treasury closes before then can test the long-rate thesis first.
Frequently Asked Questions
What is the 10-year Treasury yield today?
The latest official daily par yield verified for this article is 5.27% for October 6, 2026, according to the U.S. Treasury's daily rates. This is not a live October 7 quote. The Treasury publishes closing daily observations rather than a constantly updating price in the referenced file.
Why is the 10-year Treasury yield above 5%?
A long yield reflects the market's expected path of shorter rates plus compensation for risks of holding a longer bond, as the New York Fed's research page explains. The Treasury's 10-year par yield was 5.27% on October 6. Neither that figure nor the curve alone identifies how much came from inflation, future policy expectations or term premium.
How does the 10-year Treasury yield affect mortgage rates?
The 10-year Treasury rate is a widely watched long-maturity benchmark, but it is not a lender's mortgage offer. Mortgage quotes include other costs and spreads, and existing fixed-rate loans do not reset when the benchmark changes. The Treasury's methodology describes the benchmark as a fitted par curve derived from indicative market prices, not a household loan price.
Do FOMC minutes set the 10-year Treasury yield?
No. Minutes can change market expectations when they add information about policy deliberations, but the Fed sets a target range for overnight federal funds, not the 10-year Treasury's daily par yield. The Fed's calendar lists the September meeting and its supporting documents; this article was prepared before its minutes were published. Any claim about their content must wait for the document.
This content is for informational purposes only and does not constitute financial advice. Past performance is not indicative of future results. Consult a qualified financial advisor before making investment decisions.
Get daily intelligence delivered
Create a free account for the Daily Brief every weekday and The Week Ahead every Sunday. No card required.