VIX Explained: What 14.84 Says About Stocks Before CPI


The VIX is the options market's annualized estimate of how much the S&P 500 could fluctuate over the next 30 calendar days, not a forecast that stocks will fall. Cboe's daily closing series puts the index at 14.84 on Friday, October 9, down 3.70% from 15.41 a day earlier. That is a quiet reading relative to the 31.05 close on March 27, but it is not a 52-week low: Cboe's actual closing low in the trailing year was 13.47 on December 24, 2025. For the reaction to Friday's move, see our VIX news report. This piece explains what the number means before the next inflation release.
The practical reading is that traders have priced less near-term S&P 500 variability into options than they did in March. It does not tell a reader why that happened, whether the option premium is cheap, or what direction the index will move. The distinction matters on a week when an economic release can change the price of protection in minutes. The Bureau of Labor Statistics schedule places the September consumer price index on Wednesday, October 14, at 8:30 a.m. Eastern.
Related reading: ISM services prices paid jump to 74, the highest since July 2022, as the inflation argument flares back into the equity tape.
How we got to 14.84
Start with the scale of the move rather than the nickname "fear gauge." The exchange's historical data page provides a downloadable series of daily opens, highs, lows and closes. In that file, the VIX closed at 17.71 on September 16, 14.21 on September 22 and 16.39 on October 1. It finished October 8 at 15.41 and October 9 at 14.84. The path was uneven: volatility expectations eased in late September, bounced around the turn of the month and softened again on Friday.
That is why "near a 52-week low" needs a reference date and a choice of price. Looking back one calendar year from the last available close, Cboe's lowest daily closing observation was 13.47 on December 24, 2025. Its highest closing observation in the same window was 31.05 on March 27, 2026. Intraday lows are a different measure from closing lows; a headline can confuse the two. Our calculation uses daily closes consistently. Friday's 14.84 is 1.37 VIX points above the trailing-year closing minimum, not the minimum itself.
For the broader framework, see our Fed policy coverage.
Nor does a low reading define the next return. The history offers a useful check on any confident forecast based on a single close. Cboe recorded 16.43 on October 9, 2025, followed by 21.66 the next trading day, October 10. That example shows how quickly quoted option prices can change, not that this year's market is destined to replay last year's episode. A VIX level is an observation about current prices for a specific window. It is not a backtest of an investment rule.
The related stock tape can look calm even as one corner of it grows fragile. Our S&P 500 sector-rotation report describes a market close to a three-month high with rate-sensitive leadership. Separately, our regional-bank analysis ahead of CPI describes weakness in KRE against the broader tape. These are different market snapshots, not inputs to the VIX formula. A broad index can command modest option premiums while a particular sector carries its own risk.
The longer history also requires a methodological footnote. Cboe's historical-data page says its original 1993 index was based on S&P 100 options, and the measure was updated in 2003 to use S&P 500 options across a wider range of strike prices. The current download reaches back to 1990, but a casual comparison across the old and new methodology should not be treated as a clean, identical experiment. For today's question, the recent series is more useful than a decades-long ranking.
What the index actually measures
The Cboe methodology describes an up-to-the-minute estimate of expected S&P 500 volatility over 30 days. The ingredients are midpoints of bid and ask quotes on SPX index options, not a poll and not the prior 30 days of S&P 500 returns. Traders pay different prices for exposure to different strikes. Those prices let the exchange infer the market's aggregate expected variance; the published VIX converts that variance into annualized volatility points.
Cboe selects at-the-money and out-of-the-money puts and calls with more than 23 days and fewer than 37 days to a Friday SPX expiration. It calculates estimates for two eligible expirations and interpolates them to a constant 30-day horizon. The strike-by-strike contributions depend on option midquotes, spacing between strikes, a forward index level and a Treasury-based risk-free rate. That is more information than the premium on a single put. It is also why changes in downside put demand can affect VIX even when the S&P 500 index level itself changes little.
The methodology specifies snapshots of option bid and ask quotes every 15 seconds for intraday spot values. It also describes filters intended to suppress values that reflect unrepresentative quotes. A screen's real-time number is therefore an indicative calculation from a moving set of option quotes. A reader comparing a morning snapshot with a previous day's close must label the timestamps. The downloaded Cboe daily-close file currently ends October 9. Our analysis uses the last available closing observation and does not infer a fresh price.
Annualized volatility is often misread as a price target. Dividing 14.84% by the square root of 252 trading days gives approximately 0.93% as a one-day standard-deviation yardstick under a simplifying assumption of steady volatility. Scaling to 30 calendar days using the square root of 30/365 gives roughly 4.25%. Neither calculation says the market will move exactly that much, nor that a stated percentage is a hard boundary. Actual returns can be asymmetric or jump after news, and the option market charges for risk bearing as well as forecasting it.
The Options Industry Council's VIX educational explanation makes the basic distinction between an index reading and tradable exposure: investors cannot simply hold the index. VIX-linked futures, options and exchange-traded products have their own prices, maturities and payoff rules. A spot VIX reading of 14.84 is not the entry price of a generic hedge, nor is it the expected profit from buying one. That prevents an otherwise tempting category error in a week with a scheduled inflation print.
There are also several clocks. The spot VIX measures a constant 30-day window; an SPX put expires on its contract date; a VIX future references its future settlement mechanics. Cboe's VIX futures documentation says final settlement uses a Special Opening Quotation on expiration morning, generally a Wednesday. The SOQ is not simply the prior day's displayed VIX close. Anyone comparing spot, futures and an exchange-traded volatility product as if they were three copies of the same number will misread the signal.
One chart, two distinct lessons
Our chart plots each available Cboe daily VIX closing observation from September 14 through October 9. We copied the exchange's dates and closes into our table and rendered this line from those values. The chart's first point is 17.10 and its last is 14.84; its high is 17.71 on September 16 and low is 14.21 on September 22. It shows a lower endpoint than the starting point, with a reversal after September 22. It does not show a clean downward march or a fresh low on October 9.
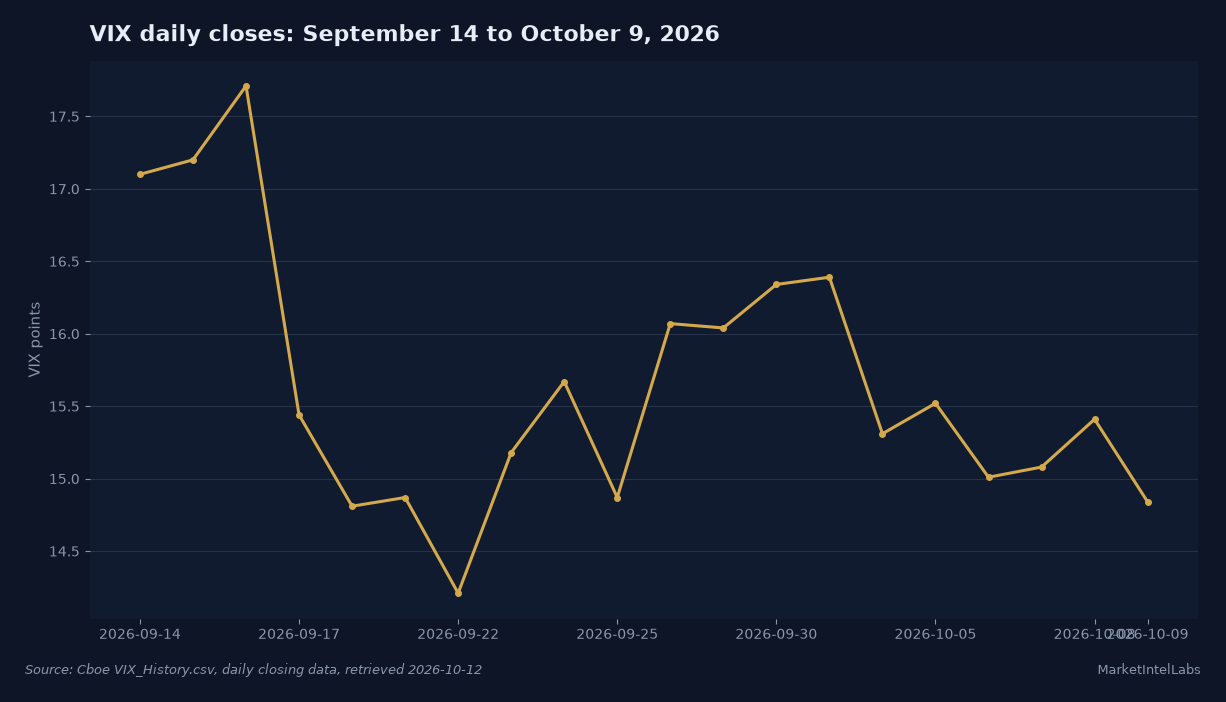
A chart of volatility points must be read differently from a chart of the S&P 500's return. It shows the market price of a 30-day expectation, not the amount the S&P 500 actually moved over the preceding month. If the line rises after CPI, the defensible first statement is that implied volatility rose. It would take a separate comparison against realized movement and the rest of the option surface to say whether option holders were well paid for what happened next.
It also helps to compare horizons rather than treating the line as an all-purpose anxiety meter. Cboe's term-structure page describes indices for nine-day, 30-day, three-month, six-month and one-year expected volatility inferred from SPX option prices. The October 14 CPI release falls within a nine-day window and also within the VIX's 30-day window, but it occupies a different fraction of each. A short-horizon measure could react more sharply to one dated event than the 30-day measure. That is a mechanism, not a claim about an unverified current nine-day quote.
There is a second term structure in VIX futures, and it answers a different question from Cboe's SPX-option term indices. A distant futures contract can trade above or below a near contract because of expectations, hedging demand and the contract's settlement date. A futures curve in contango does not mean spot VIX is expected to rise by the exact difference between two prices. Backwardation does not guarantee a stock-market decline. The futures contract is a distinct financial instrument, while the spot VIX itself is an index calculation.
What the primary documents say, and where they differ
Cboe's methodology is precise on construction and deliberately narrow on interpretation: it estimates expected 30-day S&P 500 fluctuation from SPX option quotes. Its historical-data page supplies the daily observations. Neither document says 14.84 is a safe level for stocks or identifies a catalyst that must follow. That separation is useful because commentary about the latest close can otherwise make an index sound like an independent economic release.
The Federal Reserve's November 2025 Financial Stability Report on asset valuations treats option-implied volatility as only one piece of market context. It describes volatility receding after the previous April's disruption while prices remained high relative to fundamentals across several asset markets. The document is a dated assessment, not a fresh statement on October 2026 conditions. Its lesson for reading today's VIX is methodological: a subdued option-volatility gauge and stretched asset valuations can coexist.
Those perspectives are complementary rather than contradictory. The exchange calculates what options imply about a 30-day dispersion of index returns. The Fed considers valuations, yields, liquidity and credit alongside volatility when assessing vulnerabilities. A low VIX does not settle a valuation argument. Conversely, a worrying valuation does not mechanically require a high VIX today. The price of a hedge reflects the people willing to sell one as well as the people eager to own one.
NYSE's 2026 holiday and trading-hours calendar does not list October 12 among exchange closures and lists 9:30 a.m. to 4:00 p.m. Eastern for core trading. The BLS October schedule identifies October 12 as Columbus Day and places its CPI report two days later. Those facts distinguish a holiday label from an exchange closure, and today's open market from Wednesday's scheduled release. They do not establish what the VIX will be at the close of either day.
The constructive interpretation of the recent series is straightforward: an S&P 500 option market pricing 14.84% annualized volatility at Friday's close demanded less 30-day fluctuation than when VIX ended March 27 at 31.05. That is a smaller implied-volatility reading for the broad index, potentially supportive of a calmer risk backdrop. The opposing interpretation is narrower but important: a low starting premium leaves room for a rapid repricing around CPI, while sector-specific exposures may already be more unsettled than the broad index shows. Both arguments have a measurable test in the next quoted options market.
Our own reading favors describing 14.84 as a price of uncertainty, not a verdict on the economy. The four most recent daily closes in Cboe's file, 15.01, 15.08, 15.41 and 14.84 for October 6 through 9, contain both a rise and a drop. There is no stable directional signal in those four observations. The more informative question is whether the 30-day index and shorter-horizon option pricing respond together after Wednesday's release, and how the S&P 500 actually behaves after that repricing.
What comes next
First comes the October 12 trading session. The NYSE schedule says the equity market's regular hours are 9:30 a.m. to 4:00 p.m. Eastern, despite the holiday shown on the federal data calendar. Once Cboe posts the day's close, compare it with Friday's 14.84 using like-for-like closing observations. Do not compare an intraday high on Monday against the prior year's closing low and call the difference a new 52-week record.
Then comes Wednesday, October 14. BLS schedules September CPI at 8:30 a.m. Eastern. Compare the new report with the market's option pricing before and after the release, and with the subsequent index move; a single VIX print alone will not identify whether a higher price came from inflation data, changes in option supply or wider market positioning. Our CPI coverage can address the inflation details when BLS actually publishes them. We do not substitute a forecast for the official print.
Three numerical markers keep the reading honest: 14.84 was the October 9 VIX close, 13.47 was the trailing-year closing low in Cboe's file, and 31.05 was that window's closing high. A post-CPI close below 13.47 would be a new closing low against this specific one-year comparison if the observation falls within the rolling window; a close above 14.84 would show higher 30-day implied volatility than Friday. Neither condition, on its own, proves what stock returns will do next. The sequence of fresh SPX option quotes and the new CPI data will determine which interpretation earns the stronger case.
Frequently Asked Questions
What is the VIX index?
The VIX is Cboe's index of annualized, 30-day implied volatility for the S&P 500. Its published methodology derives the reading from SPX option bid and ask quotes across multiple strikes and two expirations. It measures option-market expectations of fluctuation, not the direction of the next stock move and not the volatility already realized over the last month.
What does a VIX of 14.84 mean?
It means Cboe's October 9, 2026 daily close represented about 14.84% annualized implied S&P 500 volatility for a 30-day horizon. Under a simplified square-root-of-time conversion, that corresponds to about 0.93% for one trading day or 4.25% over 30 calendar days as standard-deviation yardsticks. Those are not guaranteed limits or forecasts of a specific return. The underlying exchange data also show that 14.84 was above the trailing-year closing low of 13.47.
Does a low VIX mean stocks will rise?
No. A low VIX means that 30-day implied fluctuation in SPX options is modest relative to a higher-VIX period. The index contains no directional forecast. Lower volatility can accompany an advancing broad market, but the option quotes can reprice if incoming information changes the distribution of expected returns. The Federal Reserve's asset-valuation assessment illustrates why quiet volatility and valuation risks need separate analysis.
Can you buy the VIX directly?
No. The index is a calculation, not an asset held like a share. The Options Industry Council explanation makes this distinction, and Cboe documents separate VIX futures and options whose prices and settlements differ from spot VIX. This explanation is educational; it is not a suggestion to use any volatility instrument.
When is the next event that could move VIX?
The BLS October 2026 calendar schedules September CPI for Wednesday, October 14, at 8:30 a.m. Eastern. VIX can change before or after that event as SPX options are repriced, and other news may also matter. The dated test is to compare Cboe's close after the release against the October 9 close of 14.84, while checking the CPI data and the S&P 500's realized move separately.
This content is for informational purposes only and does not constitute financial advice. Past performance is not indicative of future results. Consult a qualified financial advisor before making investment decisions.
Get daily intelligence delivered
Create a free account for the Daily Brief every weekday and The Week Ahead every Sunday. No card required.