Survey of Consumer Finances 2025: Wealth Rises, Debt Stays


The Federal Reserve's 2025 Survey of Consumer Finances, released October 9, 2026, puts median family net worth at $215,900, up 2% in inflation-adjusted terms from the 2022 survey; mean net worth was $1.24 million, up 7%. Median before-tax family income was $82,200, up 7% in real terms. Some 77% of families had debt, and among those borrowers the median owed was $88,100. The homeownership rate was about 66%, with median net housing value of $230,000 among homeowners. Roughly 65% of families participated in a retirement plan. The averages rose faster than the typical family's wealth, and the lower-income and younger groups did not all share in the advance.
Those are the Fed's release figures, with the exact median debt taken from its 2025-dollar historical tables. Net housing value means the value of the home less debt secured by it. The figure is conditional on owning a home; it is not an equity check payable to every American family. Likewise, the $88,100 debt median describes borrowers, not households with no debt. Reading those denominators correctly changes the story.
Related reading: Household Debt Service After the FOMC: What the New Fed Funds Level Means for Your Monthly Payments.
The 2025 survey captures a household balance sheet, not a price snapshot at a checkout counter. Its income questions refer to the calendar year preceding the interview, according to the Fed's Table 1 note. Wealth combines assets and liabilities at the survey date. These numbers therefore tell us something different from a monthly inflation report: how much financial slack families had accumulated after years of changes in prices, borrowing costs and asset values. Net worth can rise even when cash left after the monthly bills does not.
What changed since the last survey
The Fed fielded the modern survey every three years since 1989 and published the previous report covering 2019 to 2022 in 2023. That earlier report described a period of unusually large real wealth gains. For the latest comparison, the Fed's historical tables put the 2022 median at $211,100 and the 2025 median at $215,900, both in 2025 dollars. The arithmetic difference is $4,800 over three years. That three-year gain is small next to a starting balance above $200,000.
For the broader framework, see our Fed policy coverage.
Related reading: Credit Card Rates Stay Above 21% as Revolving Debt Falls in August.
At the mean, the corresponding figures were $1,164,100 and $1,241,500, a $77,400 difference in the same price units. The mean is pulled toward high-value households: it answers what wealth would be if total recorded wealth were divided across survey families. The median answers what the family in the middle had. The distance between them is the most useful warning against calling the mean the typical family's experience. The Fed rounded the changes to 2% and 7% in its release; the historical tables report dollar amounts to the nearest $100.
Income moved differently. The median climbed from $76,900 in 2022 to $82,200 in 2025, expressed in 2025 dollars in Table 1 of the historical workbook. The mean declined from $155,300 to $145,200. The Fed describes those movements as a 7% median increase and a 6% mean decrease. That combination says the distribution's center improved even though the arithmetic average fell; it does not tell us that every family earning less than the mean got a raise.
Related reading: Mortgage Rates Reach 7.40% on October 8 as Payments Climb.
A reader comparing old articles with today's dollars needs the unit on the page. The old survey's original report can present values in a different base-year dollar, while the newly released historical workbook restates every observation in 2025 dollars. Mixing a 2022-dollar number from a 2023 story with a 2025-dollar number from the latest chart exaggerates or understates the real change. This feature uses the Fed's single 2025-dollar series for both endpoints and for the chart below.
The longer record also alters the first impression. Median wealth was $115,500 in 2010, $113,100 in 2013 and $131,300 in 2016, all restated in 2025 dollars. It reached $154,400 in 2019 and $211,100 in 2022 before advancing to $215,900 in 2025. The latest step is smaller than the 2019 to 2022 jump. That distinction matters more to a family paying this month's bills than the million-dollar mean.
Related reading: Mortgage Rates Hit 7.03 Percent and the Household Bill for Borrowing Just Stepped Up.
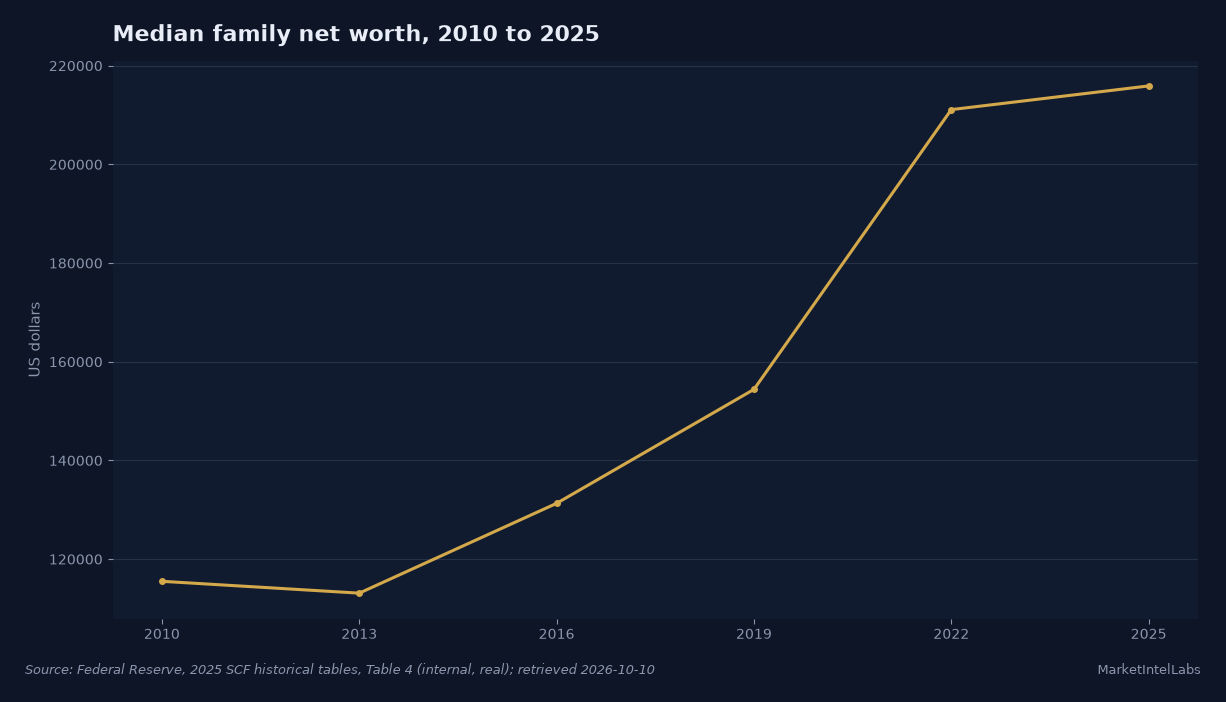
Our chart plots only the six triennial observations from 2010 through 2025 in Table 4. It is not a quarterly wealth series and cannot show the month when gains arrived. The Fed's Distributional Financial Accounts fill a different role: they use the survey's distributional information alongside the Financial Accounts to estimate wealth across groups each quarter. The concepts and frequency differ, so a DFA quarter is not a direct substitute for a newly interviewed SCF family.
Who gained, and who lost ground
The aggregate gain was not evenly divided by income. Among families in the lowest income fifth, median net worth fell from $18,500 in 2022 to $13,100 in 2025, measured in 2025 dollars. The second fifth rose from $60,700 to $79,400; the middle fifth from $187,500 to $204,400; and the fourth fifth from $327,200 to $375,500. In the 80th to 89.9th income percentile group, the median slipped from $867,600 to $845,200. In the top income decile it rose from $2,900,700 to $3,645,400. Each figure comes from the Fed's historical Table 4, which labels the brackets by family income, not by wealth rank.
That distinction matters. A high-income family is not necessarily among the richest families after debts are subtracted; a retired homeowner can have the opposite combination. The Fed's separate wealth-rank rows show the bottom wealth quarter's median dipping from $3,800 to $1,700, while the top wealth decile's median climbed from $4,152,700 to $4,935,200. These group medians do not add to the national median and do not identify how any particular family moved between brackets. The survey samples families afresh; its tables compare groups at two dates, not the same individuals followed for three years.
Age changes the picture again. Families whose reference person was under 35 had median net worth of $33,000 in 2025, down from $42,700 in 2022, in constant dollars. Ages 35 to 44 increased from $148,400 to $155,600. Ages 45 to 54 fell from $270,600 to $253,700. Ages 55 to 64 rose from $398,900 to $411,900, while ages 65 to 74 slipped from $448,600 to $431,300. For families aged 75 or more, the median rose from $367,200 to $504,900. Age brackets capture different cohorts in each survey, not the return earned by one cohort as it aged.
Among families identified by the respondent's race or ethnicity, median wealth for White non-Hispanic families rose from $311,900 to $332,100. The median for Black or African-American non-Hispanic families declined from $49,100 to $36,800. For Hispanic or Latino families it rose from $67,400 to $79,600; for the Fed's Other or Multiple Race grouping it rose from $145,400 to $205,000. These are the Fed's categories and rounded historical medians, not estimates of what race itself causes. Differences in age, housing, income and inherited assets can affect a cross-sectional comparison; the published medians alone cannot apportion the causes.
There are changes on both sides of the ledger even within a single group. Table 1 shows median income for the lowest income fifth rising from $22,000 to $22,400, while that group's median net worth fell. The top income decile's median income declined from $426,900 to $401,300 even as its median wealth climbed. Income accumulates across a year; a house or debt is measured at a point in time. A higher home valuation cannot pay a monthly bill without a transaction.
The Fed's DFA methodology clarifies what not to do with these distributions. Its charts divide aggregate household wealth among wealth percentile groups, including the bottom half and top 0.1%. The SCF Table 4 figures above are medians inside income, age and race groups. A share of aggregate wealth and a group's median are different statistics. The DFA's quarterly allocation depends on reconciling SCF and Financial Accounts balance sheets and interpolating survey distributions between survey years. It can help track the changing national pie without proving that every household in an income fifth gained when a group's share rose.
Homes, retirement and the debt bill
About 66% of families owned their primary residence in 2025, nearly unchanged from 2022, the Fed said. The more precise Table 9 asset-holding rate was 65.6% in 2025 against 66.1% in 2022. For owners, the release reports median net housing value of $230,000, up from $218,900. That is a $11,100 rise in the Fed's stated comparison. It is equity, not the price of a typical home for sale. Table 9 separately reports a $375,000 median value of a primary residence among holders in 2025; that is gross asset value, before home-secured debt is deducted.
Ownership changes the household meaning of a housing-price rise. An owner with a mortgage may gain net equity if property value climbs faster than its debt. A renter facing higher monthly rent gets no corresponding line on the asset side of the balance sheet. In the same Table 4, owners had median family net worth of $458,900 in 2025 and renters or others $10,600. Ownership does not cause the entire gap; age and income also vary. A renter cannot spend the paper gain in an owner's home.
Retirement has two denominators as well. The Fed's release says around 65% of families participated in a retirement plan, a measure that includes account-type plans, individual retirement accounts and defined benefit plans. Table 6 puts families holding retirement accounts at 54.9% in 2025, compared with 54.3% in 2022. The narrower account figure is not a correction to the broad participation number. A defined benefit plan can provide retirement income without appearing as a family's individual account balance in the same way.
Coverage is uneven: Table 6 reports retirement accounts for 13.5% of families in the bottom income fifth and 92.9% in the top income decile. It reports 48.8% for families with a reference person under 35 and 63.1% for those aged 55 to 64. These are participation shares, not average balances and not forecasts of future retirement income. The same release puts direct or indirect stock ownership at 56% of families, down from 58% in 2022, while the median stock holding among holders rose from $56,900 to $77,400. Bigger balances among those invested do not mean more families became investors.
Debt remains a near-universal feature of family budgeting, though it is not literally universal. The survey says 77% of families had some debt in 2025, against 77.4% in the 2022 historical table. The median balance among borrowers was $88,100, versus $87,800 in 2022, each in 2025 dollars. The Fed characterizes median and mean outstanding debt as essentially unchanged. The share whose debt payments exceeded 40% of income, however, climbed from 6.5% to 8.6%, a level the release says was last seen in the 2013 survey. A stable principal can become harder to service when interest, payments or income change.
There is a practical distinction between owing and making a payment. Table 13 shows 44.7% of families carrying credit card balances in 2025, with a median $3,100 balance among those families. A family that pays its card statement in full can use a card without carrying the reported revolving balance. Mortgage debt, auto installments and cards have different payment schedules and rates, so a national median outstanding balance says less about stress than the payment-to-income tail does. The 8.6% figure measures payment burden, not missed payments.
The New York Fed's Q2 2026 Household Debt and Credit release provides a useful but nonidentical cross-check: aggregate household debt on its Consumer Credit Panel was $18.771 trillion at quarter-end, down $13 billion from Q1 but $383 billion above Q2 2025. It recorded mortgage balances of $13.117 trillion, card balances of $1.263 trillion and auto balances of $1.713 trillion. Those are dollar totals on credit reports in a different period, not the median net worth, median debt or family participation share in the 2025 SCF. Rising aggregate balances can coexist with little movement in the SCF borrower's median.
The New York Fed also put 4.7% of outstanding debt in some stage of delinquency in Q2 2026. Its serious-delinquency transition measures follow loans entering 90-plus-day delinquency, not families whose payment burden exceeds 40% of income. Treating those measures as the same statistic would hide the difference between a strained but current borrower and a loan that is already late. Together the releases say something narrower, and more useful: the Fed found more families with high required payments even though the middle borrower's inflation-adjusted balance was little changed.
How to read the release without losing the household
There is measurable improvement at the middle. The median family had more income and slightly more wealth after inflation than in the 2022 survey. Owner equity rose, retirement plan participation nudged up and families in the second through fourth income fifths saw their median net worth increase. That is better than a broad real decline. The losses are concentrated but concrete: the lowest income fifth's median net worth fell, the youngest families' median fell, and a larger share of families faced a debt payment exceeding two-fifths of income.
The mean balance sheet passed $1 million, but monthly bills depend on income and cash after required payments. The survey reports stocks and flows at the family level, but these summary medians do not tell us a given family's grocery bill, insurance premium or interest rate. Its $230,000 owner equity median cannot be spent at a supermarket without a separate sale or borrowing decision. Nor is an unrealized gain in a retirement account the same as accessible emergency savings.
More detail is already available than a one-page release: the SCF landing page links the 2025 chartbook, historical tables, full public dataset, extracts, replicate weights and technical documentation. Its historical workbooks distinguish estimates from internal data and public-use data, and the tables label which measures apply only to asset holders or borrowers. The Fed's summary Bulletin is linked there as a PDF exceeding 2 MB; we did not download that large file for this report. We checked the linked release and 2025-dollar internal historical tables directly, so the article does not attribute an unverified table sentence to the PDF.
As of October 10, 2026, a complete public-use dataset and historical tables are linked on the Fed page; this is not a case where only summary tables have been published. This article has not independently computed sampling errors or a household-by-household transition from the microdata. It also cannot identify how much of an individual family's wealth change came from home appreciation, repayment or saving. The published group medians establish the direction and size of changes for the named groups, not causation for any one family.
The next useful comparison is not a fresh SCF print next month: the survey is triennial, and no date for a later release is established by these sources. The Fed's quarterly DFA and the New York Fed's subsequent debt reports can show newer aggregate or distributional estimates and credit conditions, while the 2025 SCF remains the interviewed benchmark. Watch whether the payment-burden tail eases and whether the next surveyed under-35 and low-income medians recover. A higher headline mean alone would not answer either question.
Frequently Asked Questions
What is the median net worth in the 2025 Survey of Consumer Finances?
The Fed's median was $215,900 per family, in 2025 dollars. That was 2% above the 2022 survey in real terms; the 2022 value on the same basis was $211,100. The median is the midpoint, not an amount that every family holds.
What is the average family net worth in the 2025 Fed survey?
The mean, often called the average, was about $1.24 million, or $1,241,500 in the Fed's historical table. It rose 7% in real terms from 2022. The mean exceeds the median because very high-wealth families pull up the arithmetic average.
How much debt did the typical family have in 2025?
Among families with debt, the median outstanding balance was $88,100 in 2025 dollars, per Table 13. About 77% of families had debt at all. This is a borrower-only median; it must not be assigned to a family without debt. The Fed found 8.6% of families had debt payments above 40% of income.
How many families owned a home or had a retirement plan in 2025?
About 66% owned their home, with median net housing value of $230,000 among owners. Around 65% participated in a retirement plan broadly defined, while 54.9% held retirement accounts under Table 6's narrower definition. Neither number implies that every participant had the same balance.
Did every income and age group gain wealth in the 2025 SCF?
No. In 2025 dollars, the lowest income fifth's median wealth fell from $18,500 to $13,100, and the under-35 group's fell from $42,700 to $33,000. The top income decile's median increased from $2,900,700 to $3,645,400. These are separate groups in repeated surveys, not a record of each family's personal return.
This content is for informational purposes only and does not constitute financial advice. Past performance is not indicative of future results. Consult a qualified financial advisor before making investment decisions.
Get daily intelligence delivered
Create a free account for the Daily Brief every weekday and The Week Ahead every Sunday. No card required.