Mortgage Rates Cross 7% as Builder Confidence Hits a Year Low

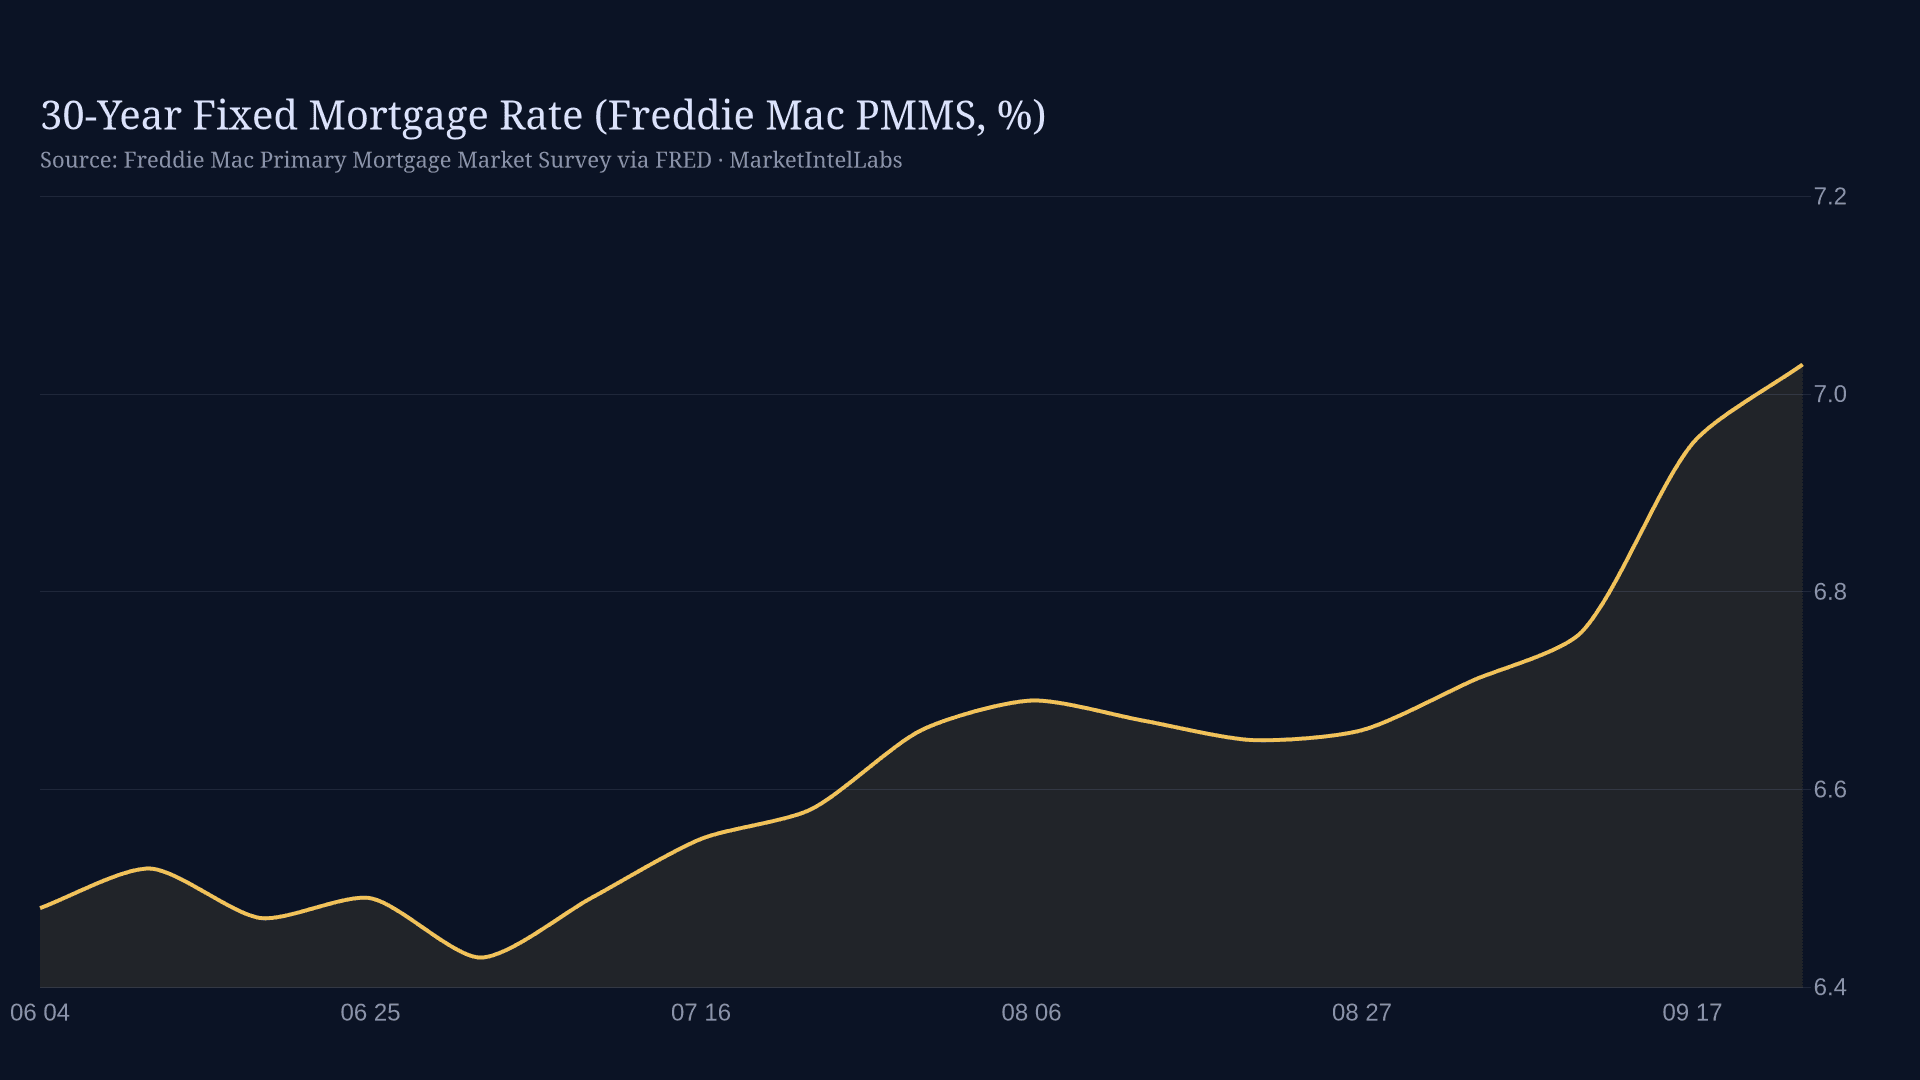
The number that defines the week of September 28 is 7.03%. Freddie Mac's Primary Mortgage Market Survey put the 30-year fixed rate at 7.03% on Thursday, September 24, the third straight weekly increase and the first print above 7% since March 2025. A year ago the same survey read 6.30%. That is 73 basis points of deterioration in twelve months, and it is reshaping every other number in this market.
Run the affordability math on the median home and the squeeze is concrete. The Census Bureau's median sales price was $410,700 in April, the latest quarter available. At 7.03% with 20% down on that price, the principal-and-interest payment is about $2,193 a month. At last September's 6.30%, the same house cost roughly $2,060. At January's 6.06% low it was closer to $1,947. The buyer of the median American home is paying roughly $2,500 more per year than the buyer who closed in January, on a house that is only slightly more expensive than it was a year ago. This is a rate story, not a price story, and the difference matters for how the next few months unfold.
Rates are the whole trade
The chart above tells the story of the year: mortgage rates started 2026 at 6.06% in mid-January, drifted through the low 6s all spring, and have now climbed roughly a full point in eight weeks. The last four Thursday prints are 6.71%, 6.76%, 6.95%, 7.03%. The driver is the bond market's repricing of the rate path, not mortgage-specific stress; the spread story that dominated 2023 and 2024 has been mostly stable, so the move is treasury yields doing the work.

What does 7% do to demand? Less at the moment of the print than the number suggests, because demand was already thin. But the second-order effects are real. Refinancing, which had briefly opened for the cohort that locked above 7.5% in late 2023, is closing again. Move-up buyers with 3% loans remain locked in place, and every basis point makes the calculus of giving that loan up worse. The lock-in effect is now the single biggest structural feature of the existing-home market, and at 7% it tightens.
Supply is loosening anyway
Here is the genuinely interesting part of this week's data. Inventory is rising despite the demand headwind. Active listings stood at 1.14 million in August, per Realtor.com data tracked on FRED, up from 1.10 million a year ago and the highest level since early 2025. Months of supply for new homes fell to 8.5 months in August from 9.0 in July, but that decline reflects faster sales, not less stock. Days on market are stretching in the Sun Belt, where the build-up of supply is most concentrated, while the Northeast remains scarce. The market is bifurcating: where builders and sellers have been most active, buyers are regaining the upper hand; where supply was never built, prices stay firm.
Builders are responding exactly the way a rational seller does when demand softens. The NAHB/Wells Fargo Housing Market Index fell three points to 32 in September, its lowest reading in a year. Current sales conditions dropped four points to 35, and future expectations dropped six points to 37. The behavior data is more telling than the sentiment number: 38% of builders cut prices in September, up from 35% in August, with the average cut holding at 6% for a sixth straight month, and 66% used sales incentives, the highest share since December. When two-thirds of the industry is buying down rates or handing out closing costs, the sticker price is no longer the real price of a new home.
New construction volume is holding up better than sentiment. Housing starts ran at a 1,275,000 annualized pace in August, down from 1,309,000 in July but above the 1,291,000 posted in August 2025, and permits came in at 1,403,000, up 4.2% year over year. Builders with land are building; they are just selling differently. New-home sales rose to 684,000 in August from 643,000 in July, though that is below the 698,000 of a year ago. The gap between the new-home market, where builders can adjust price and incentive, and the existing market, where sellers are constrained, is widening.
What to watch next
The release calendar for the next month is thin on housing but heavy on rates, which is fitting since rates are the story. September housing starts arrive October 17, existing-home sales October 21, and the September new-home sales print October 26. The NAHB October HMI lands mid-month, and after a 32 print with expectations falling six points, watch whether the price-cut share breaks above 40% for the first time this cycle. On the rates side, the next Freddie Mac survey lands Thursday, October 1.
The implication for the next four to eight weeks is straightforward. If the 30-year holds above 7%, expect the price-cut and incentive share to keep climbing, expect inventory to build through the fall, and expect the year-over-year price comparisons in Sun Belt metros to flip negative by early 2027. If rates retreat back toward the high 6s, the January cohort of buyers reappears quickly, because affordability at 6.6% versus 7.0% is about $110 a month on the median home, enough to move marginal decisions. The market's direction for the rest of 2026 is being set by the bond market, not by anything happening on a job site.
This content is for informational purposes only and does not constitute financial advice. Past performance is not indicative of future results. Consult a qualified financial advisor before making investment decisions.
Get daily intelligence delivered
Create a free account for the Daily Brief every weekday and The Week Ahead every Sunday. No card required.