Existing Home Sales Today: September Report Due at 10 a.m.


Existing home sales today are not yet a September number. The National Association of Realtors schedules its September 2026 report for Tuesday, October 13, at 10 a.m. Eastern, or 14:00 UTC. Until that release, the latest verified reading is August's 3.98 million sales at a seasonally adjusted annual rate, down 2.0% from July. That is a rate of transactions, not 3.98 million houses sold in August. The accompanying 1.62 million homes for sale and 4.9 months of supply tell a more useful story about buyer choice than the sales headline alone, according to NAR's August release.
The sales report cannot tell you that mortgage rates rose because fewer homes closed. It measures completed transactions, many of which were negotiated weeks earlier. Mortgage rates reflect financing markets and lender pricing, and the most recent Freddie Mac Primary Mortgage Market Survey put the 30-year fixed average at 7.40% on October 8. A higher rate can restrain future sales by increasing payments, while weaker closings alone do not mechanically lower the rate a new borrower is quoted.
For readers following this week's housing headlines, our report on pending-home-sales cancellations addresses contracts rather than the closed deals in today's NAR series. That timing distinction matters. A contract can fall through; a recorded closing enters existing-home sales. The new release should be read against both that pipeline and the August stock of unsold homes, not treated as a verdict from a single number.
How the housing market reached this report
The eight monthly observations from January through August trace an uneven market, not a straight-line collapse. The NAR series carried by the Federal Reserve Bank of St. Louis shows 4.02 million in January, 4.13 million in February, 4.01 million in March and 4.04 million in April, all at annualized rates. May climbed to 4.19 million. June slipped to 4.13 million, July to 4.06 million and August to 3.98 million. May to August is the consequential comparison: a recovery in one month did not establish a sustained higher sales pace.
August's 2.0% monthly decline also put sales 1.2% below a year earlier, NAR reported. The annual comparison matters because housing has an unusually strong selling season. Families relocate around school calendars; warmer months ordinarily bring more transactions. A month-to-month annualized sales comparison uses seasonal adjustment to strip out typical calendar effects, but it does not erase revisions, regional differences or the terms on which individual buyers qualified for credit.
The inventory side moved in the opposite direction. NAR counted 1.62 million homes available at the end of August, up 3.2% from July and 5.9% from August 2025. Its 4.9 months of supply compared with 4.6 months in July and 4.6 months a year before. When listings grow while transactions slow, buyers may encounter less competition. This does not mean every neighborhood has suddenly become affordable, or that sellers everywhere have lost pricing power. The statistic aggregates very different local markets.
One more apparent contradiction deserves daylight: August's national median existing-home price was $429,100, 1.6% above August 2025, even as the sales pace fell. NAR defines a median as the middle transaction, not the price of an unchanged basket of houses. A shift toward expensive regions or larger properties can move the national median without an equivalent rise in each home's value. The NAR methodology cautions that year-over-year price comparisons are more appropriate than adjacent months and that changes in the mix of homes sold can distort median prices.
At the same time, this market sits under a financing constraint. Freddie Mac measured a 7.40% 30-year average on October 8, up from 7.28% a week before and 6.30% a year earlier. Those are national averages for eligible applications, not a promise that any reader can obtain those rates. A deal negotiated at one rate and closed weeks later can appear in this month's sales count even though the current weekly mortgage quote has already changed.
What NAR counts and why the annualized rate can mislead
NAR's existing-home-sales indicator covers closings of previously owned single-family homes, townhouses, condominiums and co-ops. Its methodology says the monthly indicator uses a representative sample of 210 local boards and multiple listing services, with results weighted across four Census regions. Changes in activity outside participating listing systems need not be captured immediately. The association can revise seasonal factors and earlier adjusted sales data; an initial print is therefore an estimate of a market, not a census of every address.
A seasonally adjusted annual rate, often abbreviated SAAR, projects the current month's adjusted pace over twelve months. It is a standardized speedometer. August's 3.98 million is not August's actual count and should not be added to July's 4.06 million to obtain two months of sales. The monthly estimate is first adjusted for recurring seasonal patterns, then expressed as a yearly pace so adjacent months can be compared.
A rounded headline can make that speedometer look like a literal tally. A move from 4.06 million in July to 3.98 million in August looks like 80,000 fewer sales. The 80,000 is a difference between hypothetical annual paces, not an observed deficit of 80,000 closings during one month. It also does not isolate whether buyers walked away, sellers waited, loan terms changed, or normal closing schedules slipped across the month boundary.
Inventory needs a different unit. The 1.62 million figure is a stock of homes listed for sale at a particular point, not an annualized flow. Months of supply relates that stock to the pace at which homes are being sold. In rough terms, 1.62 million divided by the annual sales rate of 3.98 million, then multiplied by twelve, is about 4.9 months. This is not a forecast that every individual listing will sell in precisely that time. New homes can be listed, others can be withdrawn, and sales rates can change before the stock is exhausted.
This is why a September headline of higher sales with flat inventory would differ from higher sales alongside an even faster rise in inventory. The first combination would generally tighten the available stock relative to transactions; the second could still give buyers more selection. Watch the monthly change in months of supply and its year-earlier comparison, along with regional breakouts, before labeling the result a seller's or buyer's market. NAR's August release showed three regions with lower monthly sales and the West unchanged, an illustration of why national averages need local checks.
Pending contracts offer a cross-check, but not a duplicate reading. In its August Pending Home Sales release, NAR reported a 0.3% month-over-month rise in its pending index and a 4.7% year-over-year decline. A home is pending after a contract is signed; the transaction often closes within one or two months, according to NAR. A buyer can nonetheless fail to secure financing or terminate under a contractual condition. The positive monthly pending reading does not guarantee September closings will rise.
New construction is another separate market. The Census Bureau's August New Residential Sales report estimated 684,000 new single-family homes sold at an annualized pace and 483,000 new homes for sale at month's end. New-home sales are generally recorded at contract or accepted deposit, rather than at the closing used for NAR's existing-home series. The Census report warns about sampling error and revisions. Do not combine the 684,000 and 3.98 million figures and call the sum an official total for one monthly market.
The chart: a late-summer slide, not a September result
The original chart below plots the eight verified NAR annualized readings through August. It deliberately ends before September. The line rises to 4.19 million in May, then loses ground in each of the next three observations. That three-month sequence gives the October release its test: was August the trough of a choppy summer or another step in a weaker closing trend? The chart does not supply an answer that has not been published.
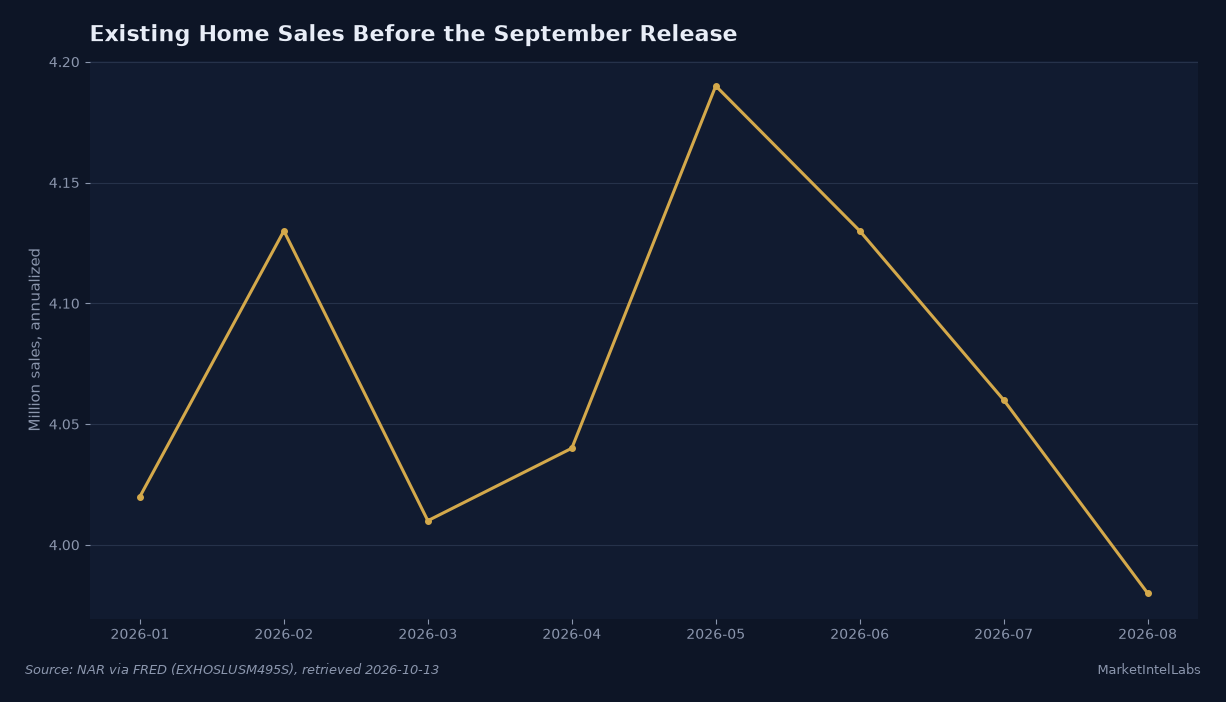
The plotted table runs from January's 4.02 million, February's 4.13 million, March's 4.01 million and April's 4.04 million to May's 4.19 million, June's 4.13 million, July's 4.06 million and August's 3.98 million. Those are the numbers retrieved for the chart from FRED's NAR series on October 13. The measure is a national seasonally adjusted annual rate in millions, not monthly closings. The publication date of a new September observation will determine when the chart can responsibly be extended.
What the primary documents say about affordability
The affordability problem is visible without claiming the September sales result in advance. Suppose a hypothetical buyer purchases at August's $429,100 national median, finances 80% of that price with a 30-year fixed loan and ignores taxes, insurance, association dues, closing costs and mortgage-rate points. That leaves a $343,280 principal. At Freddie Mac's October 8 average of 7.40%, the calculated principal-and-interest payment is about $2,377 per month. At the survey's 6.30% average from a year earlier, the same principal over the same term would cost about $2,125, or $252 less each month. This holds the home price fixed to isolate the interest-rate effect; it is an illustration, not a quote or advice for a particular borrower.
The $252 difference would be about $3,024 across twelve payments on this stylized loan. Actual year-ago buyers faced a different distribution of home prices, discounts, credit scores and fees. Freddie Mac says its Primary Mortgage Market Survey draws rates from thousands of applications submitted through Loan Product Advisor by participating lenders. Since 2022 it has used application data rather than its former lender survey. The survey's rate cannot substitute for a lender's personalized loan estimate, and it describes a weekly average rather than the financing terms on every home that closed in September.
Rates and sales also operate on different clocks. Freddie's latest weekly number measures recent applications; NAR's existing sales are deeds that have reached closing. A buyer can sign when the interest rate is lower, lock a rate, then appear later in a closing series after the market moves. Some owners with older low-rate mortgages may be reluctant to list because replacing their loan would increase their payment. That lock-in mechanism can hold down both available supply and the number of transactions. Its possible presence does not by itself prove how much of September's change comes from rates.
The median-price data gives another reason not to equate slower volume with immediate lower prices. In August the national median rose 1.6% from a year earlier even as annual sales slipped 1.2%, according to NAR. Fewer transactions can coexist with stubborn prices if sellers defer moving or if the set of homes that do sell changes. More listings and slower turnover can improve buyers' negotiating position without producing a national price drop the same month. NAR Chief Economist Lawrence Yun described August's 4.9 months of supply as the highest level in more than ten years and said more available homes were giving buyers room to negotiate. That is his interpretation of the national release, not evidence about a specific street.
There is a bullish reading of the broader market: inventory improved from both July and a year ago, which could allow more deals to clear if borrowing costs ease and contracts survive to closing. There is a bearish reading too: with the 30-year survey rate at 7.40% and the median price still above its year-earlier level, payment pressure can limit who qualifies even if listings increase. The report is most useful when both claims are tested against supply, prices and completed sales together. Neither interpretation justifies an individual decision to buy or sell based on a single national print.
Our housing inventory and seller price-cut analysis supplies another perspective on buyer choice, although its listing measures are not NAR's count of completed sales. Closer to the closing pipeline, our new-home-sales analysis examines builder transactions, which Census counts differently from NAR's existing homes. In both cases, the relevant question is whether a household can sustain the full payment through closing and beyond, not merely whether one national indicator moves up.
What to watch after 14:00 UTC
The NAR statistical release calendar lists September Existing-Home Sales for Tuesday, October 13. The association's series page specifies 10:00 a.m. Eastern for the September release. At the time this article was prepared, the September number was still future information. Anyone reading afterward should check NAR's dated release rather than assume August's 3.98 million remains the latest observation.
Start with the new annualized sales pace and whether the August reading of 3.98 million has been revised. Then check the month-over-month and year-over-year changes. Next, put end-of-month inventory beside the new months-of-supply figure. If sales accelerate while inventory rises more slowly, supply could tighten even though the raw number of listings is larger. If sales weaken while inventory grows, buyers may see more choice, subject to the local mix and available financing. The national median price should be compared with September 2025, not treated as a clean month-to-month price index.
The next scheduled corroborating observations are not interchangeable with today's release. NAR's calendar lists the September Pending Home Sales Index for October 20. The Census Bureau says its September new-home-sales report is scheduled for October 27. Freddie Mac publishes its mortgage-rate survey weekly on Thursdays, so a later rate reading can show whether the October 8 rise to 7.40% persists. These are separate windows on contracts, new construction and financing. Taken together over time, they can reveal whether a change in closings is lasting or merely the noise of a single report.
One question would change this analysis fastest: does the new months-of-supply reading reverse August's increase to 4.9? An unexpected contraction accompanied by stronger closings would weaken the thesis that buyer selection is improving. A further increase alongside weak sales would strengthen that interpretation but would not ensure cheaper mortgages or falling prices. The useful conclusion is narrow and testable: September's sales rate measures the pace of completed deals, while inventory, prices and financing determine what that pace means for households.
Frequently Asked Questions
What time do existing home sales come out today?
NAR schedules September 2026 existing-home sales for Tuesday, October 13, at 10:00 a.m. Eastern, or 14:00 UTC. The September result was not available when this feature was prepared. Check the dated NAR release for the actual figure and any revisions to prior months.
What do existing home sales measure?
NAR estimates completed transactions in previously owned single-family houses, townhouses, condos and co-ops, drawing on local boards and multiple listing services. Its headline is a seasonally adjusted annual rate: the yearly pace implied by the adjusted monthly flow, not the literal number of closings in that month.
Why do existing home sales matter for mortgage rates?
Sales can reveal how borrowers respond to financing costs, but the NAR closing count does not directly set mortgage rates. Lenders' quotes respond to broader funding and credit conditions; Freddie Mac's weekly mortgage survey is a separate measure. Because contracts and closings can be weeks apart, the direction of one sales print does not establish the direction of this week's mortgage quote.
What is months of supply in the existing home sales report?
Months of supply compares available homes with the current rate of sales. NAR reported 1.62 million homes on the market and 4.9 months of supply for August 2026, up from 4.6 months in July. It is a national market-balance indicator, not a guaranteed time to sell a particular house.
Are pending home sales the same as existing home sales?
No. A pending sale is a signed contract, while an existing-home sale enters NAR's closing count after the transaction completes. NAR's August pending index rose 0.3% from July while completed existing-home sales fell 2.0%. Different timing and canceled contracts can make the series diverge.
This content is for informational purposes only and does not constitute financial advice. Past performance is not indicative of future results. Consult a qualified financial advisor before making investment decisions.
Get daily intelligence delivered
Create a free account for the Daily Brief every weekday and The Week Ahead every Sunday. No card required.