Pending Home Sales Fall 4% as Cancellations Reach 14.5%

Pending home sales fell 4% month over month in September to 316,652, their lowest level since spring 2014 outside the pandemic shutdown. Redfin’s October 12, 2026 report also found 14.5% of contracts canceled, the highest share in its records apart from March and April 2020. Buyers are not just signing fewer contracts. More of those who sign are walking away.
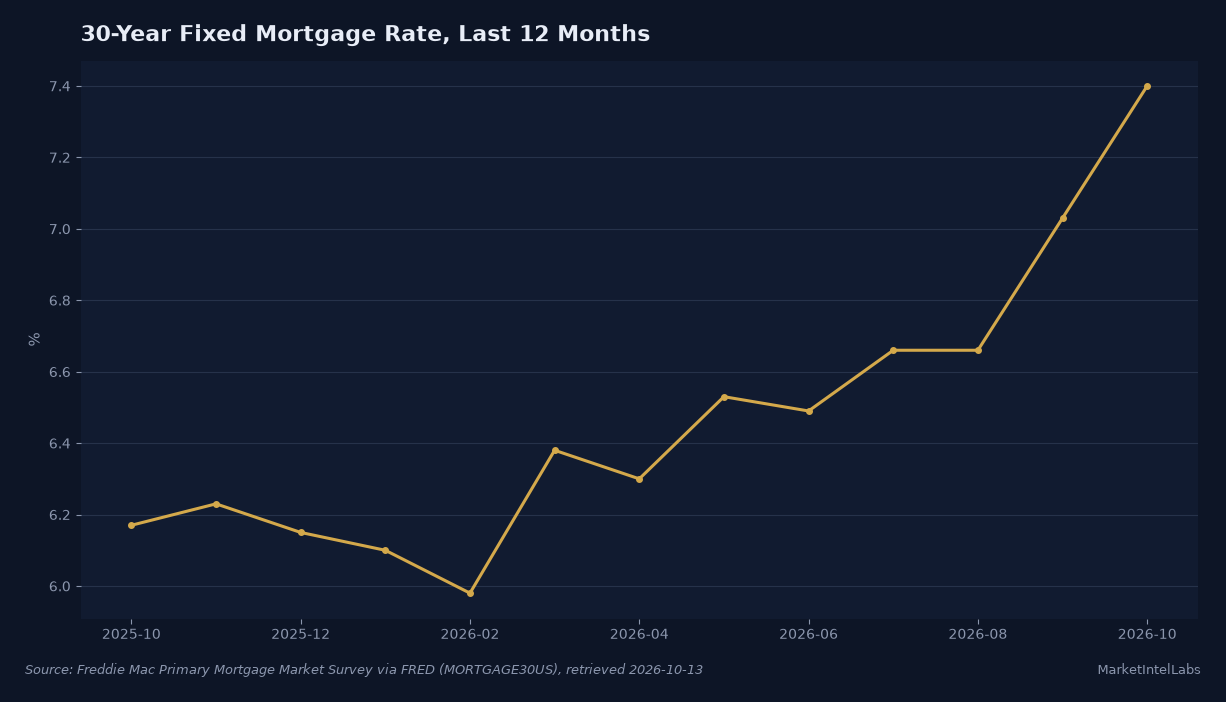
This is a cleaner sign of market strain than another headline about rates. Freddie Mac’s weekly survey put the 30-year fixed rate at 7.40% on October 8, 2026, up from 6.30% on October 9, 2025. The higher borrowing cost is now meeting a larger choice of homes and buyer room to negotiate. Still, a growing supply of listings does not automatically make housing affordable when the typical payment has moved higher.
Related reading: Zillow: Monthly Mortgage Payment Up 6.7% as Pending Sales Fall 8.5%.
Contracts expose the affordability squeeze
Pending sales measure signed contracts before closings, so they respond earlier than completed-sale counts. Redfin’s September figure was seasonally adjusted. It fell to 316,652, below April 2014’s 314,664 only in the unusual comparison with pandemic disruptions in April 2020, when pending sales were 299,829. The report said every one of the 50 largest metro areas recorded a year-over-year decline in pending deals.
Regional data point to the role of price as well as rates. Seattle pending sales were down 24.4% year over year in September 2026, while Los Angeles fell 16.0%, San Diego 15.8%, and Anaheim 15.5%, Redfin reported. Those are costly markets where a higher monthly payment can remove marginal buyers quickly. The nationwide median sale price was still $393,895 in September, 1.3% above a year earlier, so the affordability adjustment has come more through reduced activity than a broad nominal price decline.
Related reading: Freddie Mac's 7.28% Rate Reprices Fall Housing Demand.
Redfin calculated that 14.5% of pending transactions in September 2026 fell through. Its comparison chart shows 15.6% in April 2020. The recent figure is therefore extraordinary, but not a new all-time record when the initial pandemic freeze is included.
That distinction matters. A contract cancellation can reflect inspection issues, financing, appraisal gaps, changed plans, or a buyer’s willingness to wait. It is not a direct count of mortgage denials.
Related reading: September Housing Data: Listings Rise, Contracts Fall.
For an affordability illustration, apply a 20% down payment to Redfin’s September 2026 median sale price of $393,895. The resulting $315,116 mortgage at Freddie Mac’s October 8, 2026 average rate of 7.40% costs about $2,182 a month in principal and interest on a 30-year fixed schedule. Using the 6.30% rate listed for a year earlier on Freddie Mac’s October 8, 2026 survey page, the same loan amount would cost about $1,950, a difference of roughly $231 per month.
Taxes, insurance, mortgage insurance, closing costs, and actual loan terms are excluded. This is a comparison, not a quote for any household.
Related reading: Fannie Mae Mortgage Applications Fall 14.3% as Rates Rise.
Prices are not standing still everywhere, and the national median can conceal local declines. Redfin reported that 60.5% of homes sold in September 2026 closed below their original asking price. Asking prices were down 0.5% from August, while the median sale price was up 1.3% year over year.
Sellers are conceding more often. Yet the national median remains positive, shaped by the mix of completed sales and regional supply.
More listings, but uneven relief
Redfin reported that total supply of homes for sale increased 1.2% month over month in September 2026 to its highest level since March 2020. This is a meaningful improvement in choice, but the release does not give a months-of-supply measure in its summary, so the listing count alone cannot show how many months of demand that inventory would cover. The number of new listings ticked up 0.3% month over month in September 2026, which Redfin said was similar to the small swings of the prior year. Supply is rising as demand recedes, not because a wave of new sellers has entered.
National totals also blur the difference between regions. Redfin’s recent metro data showed more active listings year over year in many Sun Belt markets, while several Northeast markets remain tighter. A national rise can therefore give buyers room to negotiate for a buyer in one city without easing scarcity in another. Months of supply, local price cuts, and days on market are better guides to a specific market than the national listing count.
There is a counterpoint to the slowdown. Buyers who remain active face less competition, and Redfin says more homes are selling below their original asking price. That could create room for concessions or more time to assess a property. But the cancellation data also warns that a signed contract is not the same as a completed purchase, and high financing costs can still disrupt a deal before closing.
The next useful test is whether October mortgage rates ease from the October 8 reading and whether the next completed-sales data confirm the drop in contracts. Watch the pending-sales release, purchase applications, and local inventory together. If listings remain elevated while contracts stay weak, sellers may need to adjust prices or terms. If rates decline and contract activity stabilizes, the September fall may prove a temporary setback rather than a fresh leg down.
This content is for informational purposes only and does not constitute financial advice. Past performance is not indicative of future results. Consult a qualified financial advisor before making investment decisions.
Sources: Redfin, U.S. Pending Home Sales Sink Near 12-Year Low, October 12, 2026; Freddie Mac Primary Mortgage Market Survey, retrieved October 13, 2026.
Get daily intelligence delivered
Create a free account for the Daily Brief every weekday and The Week Ahead every Sunday. No card required.